Index Flows Calculator
Product Type:
Web App
Roles:
Product Designer
Design Engineer
Tools Used:
Retool
Figma
Time period:
09/2024 - Ongoing
Overview
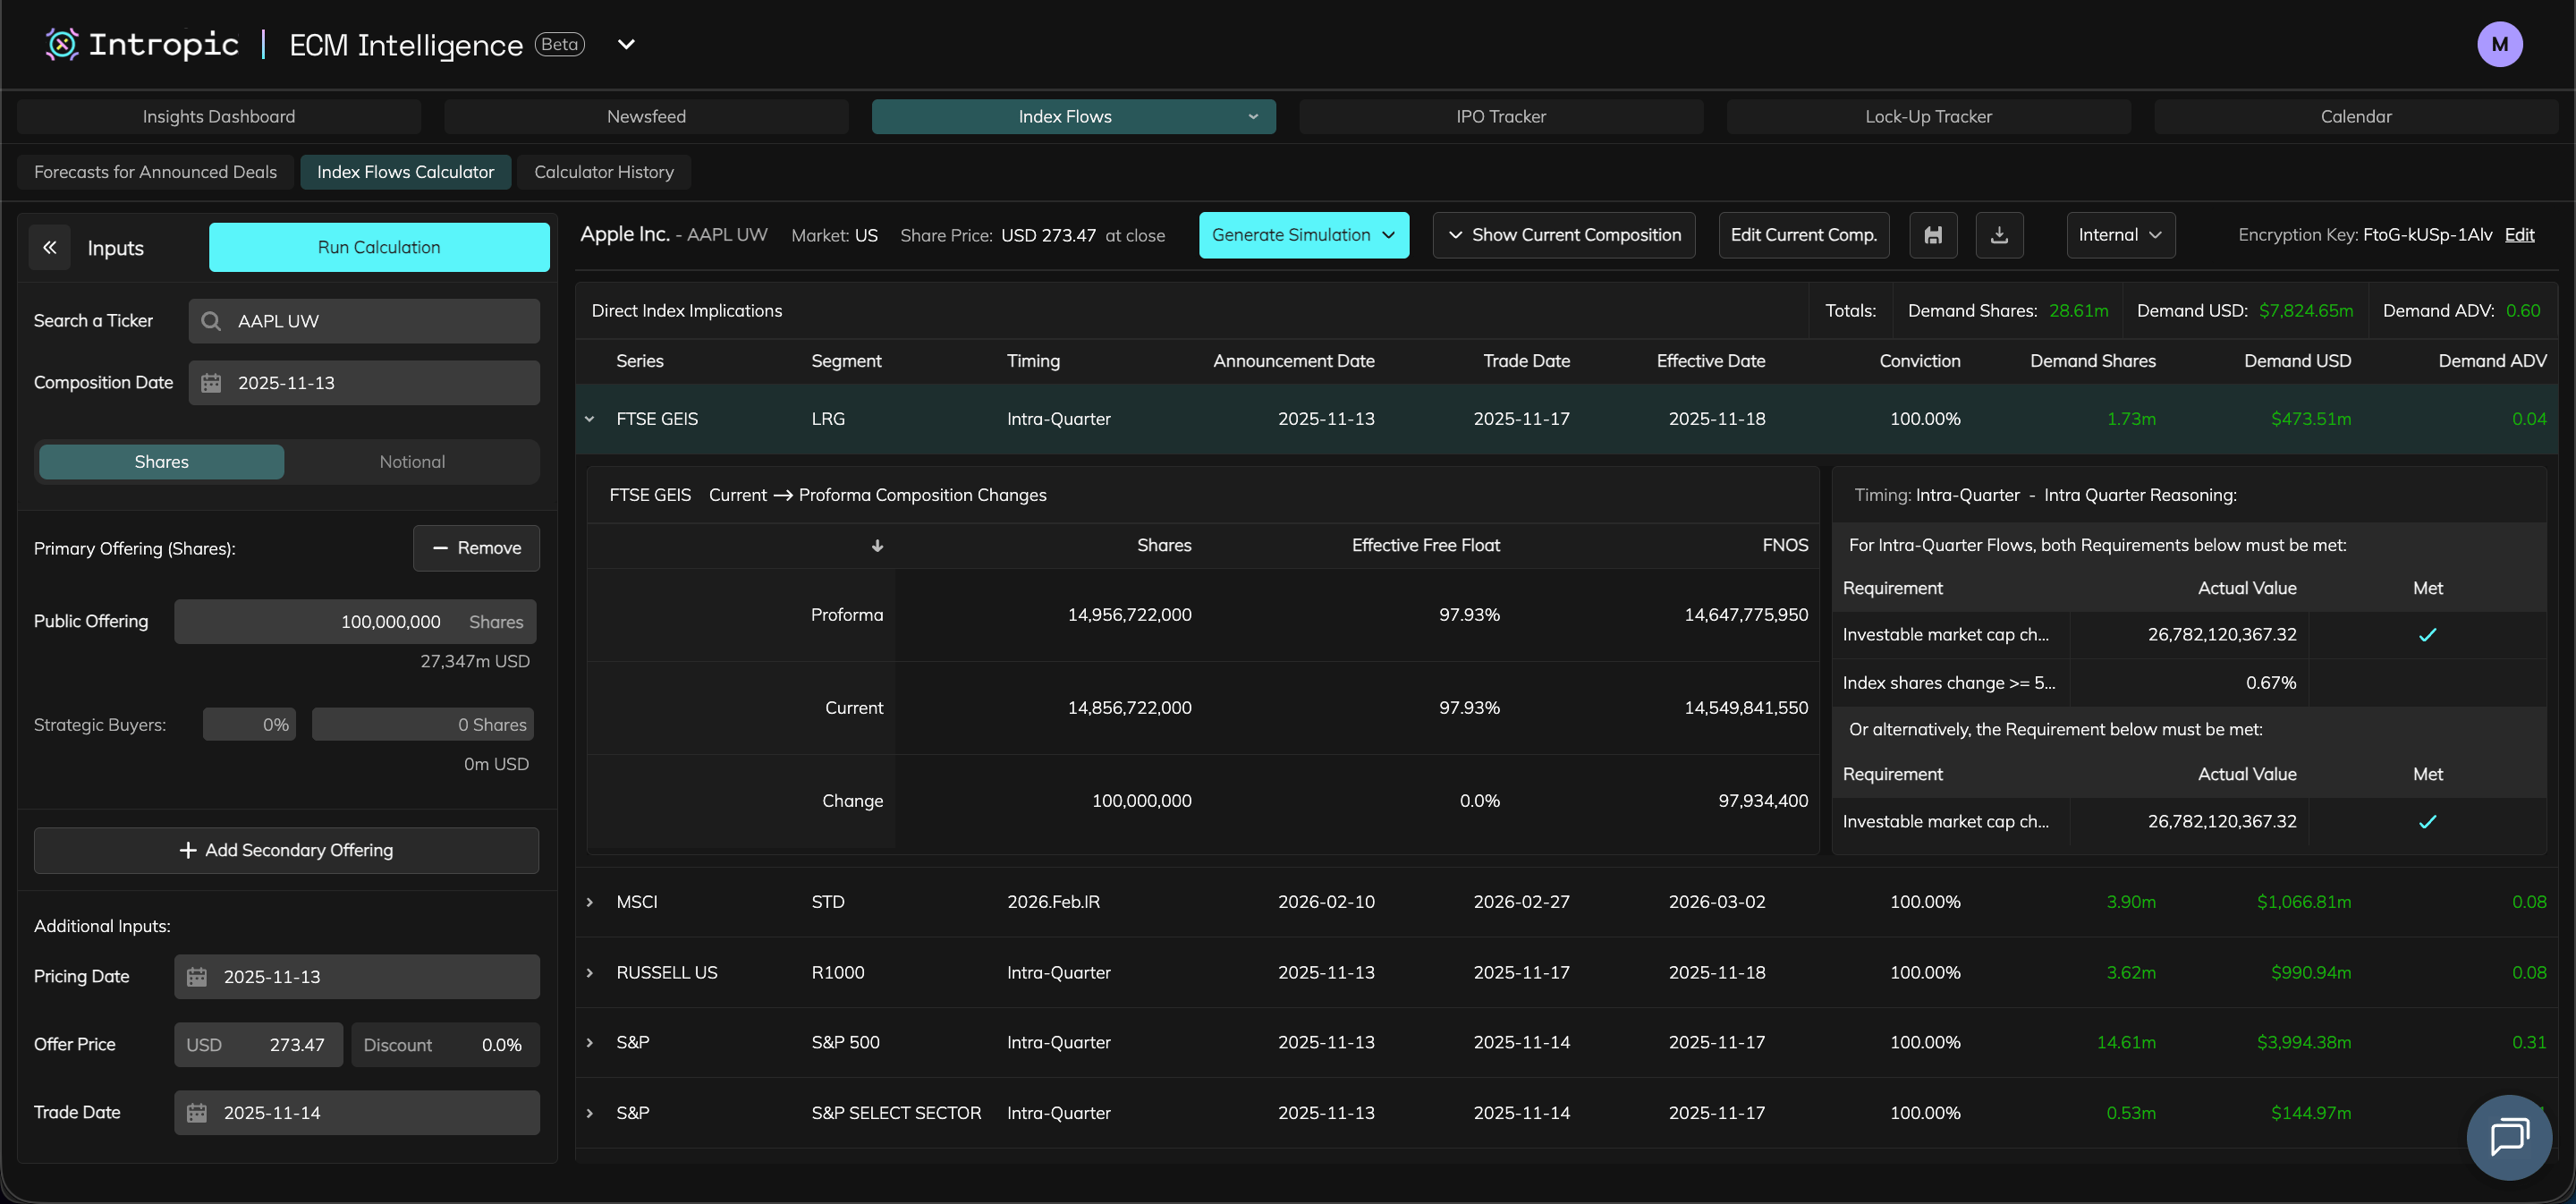
The Index Flows Calculator is designed to help Equity Capital Markets professionals understand and forecast how new offerings effect index composition and passive demand.
Users can run quick calculations to show if offerings result in an Intra-Quarter addition to indexes, and also generate simulations to see how the offering effects the weighting of other companies along with resulting passive demand flows. I led the UX/UI, designing the product end-to-end from UX research, prototyping in Figma and implementing the front-end in Retool.

Role
Product DesignerDesign Engineer (Retool)

Team
1x Backend engineer
1x Analyst / PM

Users
26 active repeat users in the month of October 2025

Project Impact
Delivered to paying users with repeat usage and increasing adoption

Outcome & Impact
Quarterly Repeated Usage Metrics as of October 2025
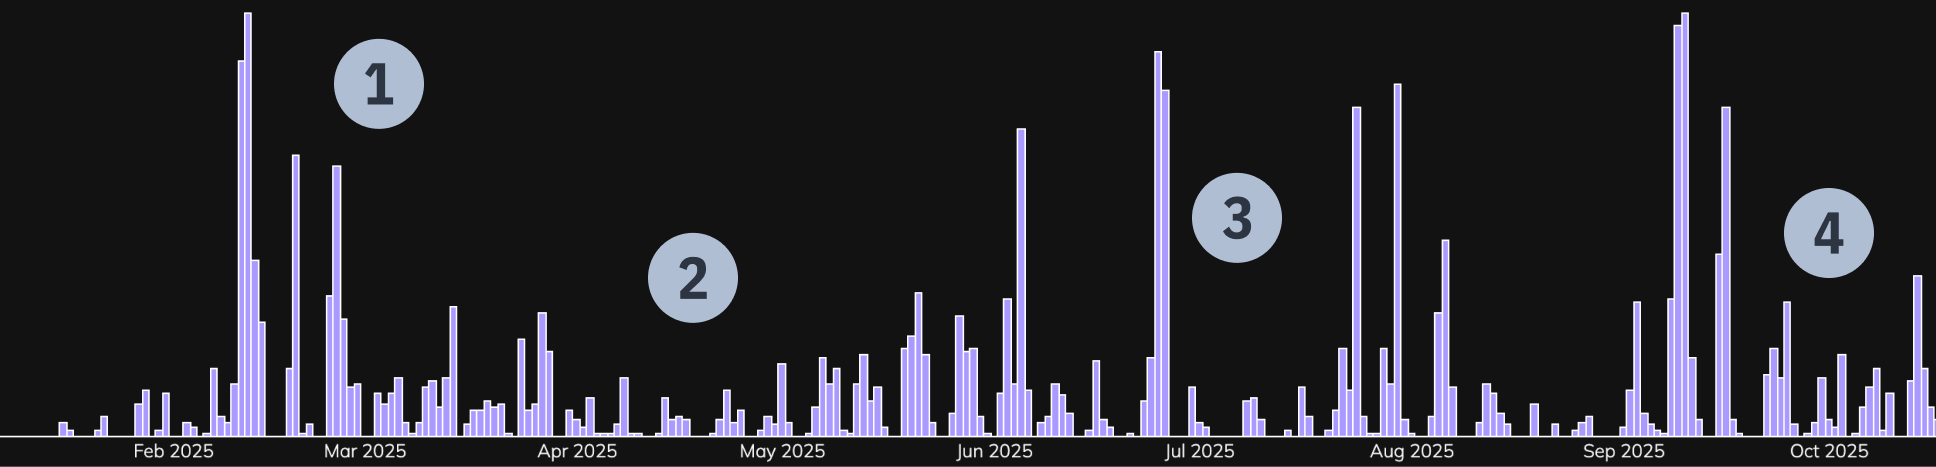
1
Product initially launched to many users on a trial basis.
2
Usage drops then grows as we iterate on feedback and expand user base with clients who the product is a fit for.
3
Becomes apparent that usage spikes around offering rumours.
4
Integrating the product into the ECM Intelligence platform increases average usage further.

Project Start

Challenge
Users needed a way to quickly forecast how company offerings influence index composition and trigger intra-quarter rebalances. Existing manual models were time-consuming and inconsistent. The challenge was to design a calculator that simplified complex inputs while running heavy forecast computations within Retool’s constraints.

Goals
- Allow analysts to model potential index-flow impact for primary / secondary offerings.
- Present complex data in a clear, actionable way.
- Enable saving and sharing of calculations.
- Ensure scalability for future updates.

Constraints
- As one of the first company products to be built in Retool, I had to replicate the design system into the Retool UI.
- Dark-mode and accessibility requirements to adhere to company brand.
- Long simulation jobs (15 min – 1 hr) required status visibility and notifications.

Research & Discovery
- Collaboration with analysts, client team and their analytics tools, and internal stakeholders helped me understand user goals and pain points.
Corporate Actions / ECM Analysts

Conducted research sessions
- Learned that manual workflows and spreadsheets slowed analysis; needed a faster workflow, dynamic inputs, and an ability to share outputs.
Client Team / Analytics Tools

Client query review & feedback
- Recurring requests for index impact tools with clear outputs. This would also let clients run their own calculations and forecasts lessening strain on the Client Query team.
Stakeholders

Review sessions
- Had to ensure an high level of product performance and experience / design consistency with existing product suite.

User Flow and Required Features
- The Research & Discovery phase helped me put together a user flow and list of necessary features for the product.

Search for a company / ticker

Current composition table loads
Select input type
Input offering data

Click ‘Run Calculation’


Download Calculation button is shown

Click download Calculation button

CSV file of results is downloaded
Calculation table is generated

‘Generate Forecast’ dropdown shown

Click ‘Generate Simulation’ dropdown
‘Probabilistic’ & ‘Deterministic’ options shown
Click either option
‘Generate Simulation dropdown changes to ‘Generating Simulation status and a ‘View Progress’ button
Click ‘View Progress’ button
Side panel appears showing progress and steps of forecast generation
Forecast finishes generating (15mins - 1hr depending on forecast type)
Success:
Side panel reappears if closed with a ‘View Simulation’ button
AND
User is notified via email that forecast is complete
Failure:Notification appears describing error and to contact support if necessary
Save Calculation button is shown

Click save Calculation button
Save Calculation modal is shown, user prompted to name Calculation before saving
Input Calculation name
Save button within modal is shown
Click save button within modal
Success:
Notification appears saying Calculation has saved successfully and modal closes
Failure:Notification appears describing error
OR
If user has input an existing Calculation name then they are prompted to change it
Share Calculation button is shown

Click share Calculation button

Share Calculation modal is shown, user can choose to share by inputing email addresses or uploading a CSV of email addresses
Share Calculation button is shown

Click share Calculation button

Share Calculation modal is shown, user can choose to share by inputing email addresses or uploading a CSV of email addresses


Input email address(es)

Share button within modal is shown
Click share button within modal
Success:
Notification appears saying Calculation has shared successfully and modal closes
Failure:Notification appears describing error and to contact support if necessary
Drag & drop / upload a CSV file
Share button within modal is shown
Click share button within modal
Success:
Notification appears saying Calculation has shared successfully and modal closes
Failure:Notification appears describing error and to contact support if necessary

Required Feature / Component
User need it solves
Input Panel
- Enter known data about an offering to seed a forecast.
Calculation & Composition Tables
- Tables to display and compare current index composition with forecasted changes.
Intra Quarter Requirement Info
- Table explaining rebalance rules and thresholds.
Save & Download
- Keep calculations for reuse and analysis. For Saving, pre-filling required Calculation names using user inputs would speed up workflow.
Share Modal
- Send forecasts to colleagues directly from the platform.
Calculator History
- Review past forecasts and inputs for without having to continually re-enter them.
Simulation Panel
- Displays simulation generation progress and send email alerts on completion.

Design & Iteration
- Prototyped key flows in Figma to validate input hierarchy and data layouts.
- Iterated while testing with the PM and analysts
- Components had to adhere to the company theme and design system while also being feasible to create in Retool.

Design Engineering Requirement
The product had to be built in Retool. Designs needed to adhere to its limitations and my developing knowledge of Retool workarounds.
Input Component Wireframe
- Search for a company / ticker
Using progressive disclosure was not only key in building the app, but also each component to avoid an initial feeling of visual / data overload for the user.
- User enters ticker.
- Composition defaults to todays date.
Inputs
Run Calculation
Enter a ticker
Composition date: 2025-01-01
Shares
Notional
Add a Primary Offering +
Add a Secondary Offering +
Additional Inputs
Pricing date
Offer Price
Discount
Trade date
Third part allotment:
Filing date
Trade date

Table Component Wireframes
- Variations of the table were required to display Current Compositions, Calculations and History. The wireframes below also use progressive disclosure by housing additional row data within expandable rows.
Calculation Table
Direct Index Implications
Total:
Shares: - |
USD: - |
ADV: -


Series
FTSE GEIS
MSCI
Segment
-
-
Timing
-
-
Announced Date
-
-
Trade Date
-
-
Effective Date
-
-
Conviction
-
-
Shares
-
-
USD
-
-
ADV
-
-
MSCI Current → proforma composition changes
proforma
current
change
Segment
-
-
-
Shares
-
-
-
Free float
-
-
-
FNOS
-
-
-
Intra Quarter Reasoning
Requirement
-
-
-
Actual value
-
-
-
Met
-
-
-

USTSM
S&P
-
-
-
-
-
-
-
-
-
-
-
-
-
-
-
-
-
-
Calculator History Table
- Filters were also needed in this table to allow users to search for their desired row faster. These filters are for Ticker, Category (Calculation or Simulation) and Ownership (Owner or Shared).

Ticker
AAPL UW
1812 JT
ID
-
-
Name
-
-
Date Created
-
-
Category
-
-
Subcategory
-
-
Ownership
-
-
Shares
Share
Share
USD
Download
Download
Inputs
name
-
-
-
Value
-
-
-
Direct Index Implications
Total:
Shares: - |
USD: - |
ADV: -
Series
FTSE GEIS
MSCI
Segment
-
-
Timing
-
-
Announce Date
-
-
Trade Date
-
-
Effective Date
-
-
Conviction
-
-
Shares
-
-
USD
-
-
ADV
-
-
USTSM
S&P
-
-
-
-
-
-
-
-
-
-
-
-
-
-
-
-
-
-
Share Calculation Modal Wireframes
Share Calculation
Enter Email
Upload CSV
Enter user email addresses
abcdefghijk@hedgefund.com

abcdefghijk@hedgefund.com
abcdefghijk@hedgefund.com
abcdefghijk@hedgefund.com
abcdefghijk@hedgefund.com
abcdefghijk@hedgefund.com
abcdefghijk@hedgefund.com
abcdefghijk@hedgefund.com
Cancel
Send
- Modal had to allow for quick and easy sharing of calculations.
- Ability to show recently uploaded CSVs means users don’t need to constantly upload files they use frequently multiple times.
- A users ‘Group’ would be shown in the dropdown when typing.

Implementation & Launch
- Built the production front end in Retool, implementing components with HTML, CSS, and JavaScript while utilising AI-assisted code to accelerate development. Delivered production-ready UI and handled QA for front-end flows.
- Translated Figma components into Retool with performance-minded workarounds for platform constraints.
- Collaborated closely with backend engineers to wire API endpoints.
- Delivered production-ready UI and handled QA for front-end flows.
- Beta product was launched to users.
Running a Calculation

Key Learnings
- Bridging design and engineering was essential. Working directly in Retool tightened design-to-delivery cycles.
- AI as a design engineer’s assistant helped speed development but still needed human review for accuracy.
- Consistent component systems made new tools feel instantly familiar to users.
- Iterative validation with analysts ensured outputs matched domain expectations before public release.
- If I were to do it again, I’d push stakeholders to get ECM user feedback earlier so there is a product fit on launch.
Index Flows Calculator
Product Type:
Web App
Roles:
Product Designer
Design Engineer
Tools Used:
Retool
Figma
Time period:
09/2024 - Ongoing
Overview
The Index Flows Calculator is designed to help Equity Capital Markets professionals understand and forecast how new offerings effect index composition and passive demand.
Users can run quick calculations to show if offerings result in an Intra-Quarter addition to indexes, and also generate simulations to see how the offering effects the weighting of other companies along with resulting passive demand flows. I led the UX/UI, designing the product end-to-end from UX research, prototyping in Figma and implementing the front-end in Retool.
Role
Product DesignerDesign Engineer (Retool)
Team
1x Backend engineer
1x Analyst / PM
Users
26 active repeat users in the month of October 2025
Project Impact
Delivered to paying users with repeat usage and increasing adoption
Outcome & Impact
Quarterly Repeated Usage Metrics as of October 2025
1
Product initially launched to many users on a trial basis.
2
Usage drops then grows as we iterate on feedback and expand user base with clients who the product is a fit for.
3
Becomes apparent that usage spikes around offering rumours.
4
Integrating the product into the ECM Intelligence platform increases average usage further.
Project Start
Challenge
Users needed a way to quickly forecast how company offerings influence index composition and trigger intra-quarter rebalances. Existing manual models were time-consuming and inconsistent. The challenge was to design a calculator that simplified complex inputs while running heavy forecast computations within Retool’s constraints.
Goals
- Allow analysts to model potential index-flow impact for primary / secondary offerings.
- Present complex data in a clear, actionable way.
- Enable saving and sharing of calculations.
- Ensure scalability for future updates.
Constraints
- As one of the first company products to be built in Retool, I had to replicate the design system into the Retool UI.
- Dark-mode and accessibility requirements to adhere to company brand.
- Long simulation jobs (15 min – 1 hr) required status visibility and notifications.
Research & Discovery
- Collaboration with analysts, client team and their analytics tools, and internal stakeholders helped me understand user goals and pain points.
Corporate Actions / ECM Analysts
Conducted research sessions
- Learned that manual workflows and spreadsheets slowed analysis; needed a faster workflow, dynamic inputs, and an ability to share outputs.
Client Team / Analytics Tools
Client query review & feedback
- Recurring requests for index impact tools with clear outputs. This would also let clients run their own calculations and forecasts lessening strain on the Client Query team.
Stakeholders
Review sessions
- Had to ensure an high level of product performance and experience / design consistency with existing product suite.
User Flow and Required Features
- The Research & Discovery phase helped me put together a user flow and list of necessary features for the product.
Search for a company / ticker
Current composition table loads
Select input type
Input offering data
Click ‘Run Calculation’


Download Calculation button is shown
Click download Calculation button
CSV file of results is downloaded
Calculation table is generated
‘Generate Forecast’ dropdown shown
Click ‘Generate Simulation’ dropdown
‘Probabilistic’ & ‘Deterministic’ options shown
Click either option
‘Generate Simulation dropdown changes to ‘Generating Simulation status and a ‘View Progress’ button
Click ‘View Progress’ button
Side panel appears showing progress and steps of forecast generation
Forecast finishes generating (15mins - 1hr depending on forecast type)
Success:
Side panel reappears if closed with a ‘View Simulation’ button
AND
User is notified via email that forecast is complete
Failure:Notification appears describing error and to contact support if necessary
Save Calculation button is shown
Click save Calculation button
Save Calculation modal is shown, user prompted to name Calculation before saving
Input Calculation name
Save button within modal is shown
Click save button within modal
Success:
Notification appears saying Calculation has saved successfully and modal closes
Failure:Notification appears describing error
OR
If user has input an existing Calculation name then they are prompted to change it
Share Calculation button is shown
Click share Calculation button
Share Calculation modal is shown, user can choose to share by inputing email addresses or uploading a CSV of email addresses
Share Calculation button is shown
Click share Calculation button
Share Calculation modal is shown, user can choose to share by inputing email addresses or uploading a CSV of email addresses

Input email address(es)
Share button within modal is shown
Click share button within modal
Success:
Notification appears saying Calculation has shared successfully and modal closes
Failure:Notification appears describing error and to contact support if necessary
Drag & drop / upload a CSV file
Share button within modal is shown
Click share button within modal
Success:
Notification appears saying Calculation has shared successfully and modal closes
Failure:Notification appears describing error and to contact support if necessary

Required Feature / Component
User need it solves
Input Panel
- Enter known data about an offering to seed a forecast.
Calculation & Composition Tables
- Tables to display and compare current index composition with forecasted changes.
Intra Quarter Requirement Info
- Table explaining rebalance rules and thresholds.
Save & Download
- Keep calculations for reuse and analysis. For Saving, pre-filling required Calculation names using user inputs would speed up workflow.
Share Modal
- Send forecasts to colleagues directly from the platform.
Calculator History
- Review past forecasts and inputs for without having to continually re-enter them.
Simulation Panel
- Displays simulation generation progress and send email alerts on completion.
Design & Iteration
- Prototyped key flows in Figma to validate input hierarchy and data layouts.
- Iterated while testing with the PM and analysts
- Components had to adhere to the company theme and design system while also being feasible to create in Retool.
Design Engineering Requirement
The product had to be built in Retool. Designs needed to adhere to its limitations and my developing knowledge of Retool workarounds.
Input Component Wireframe
- Search for a company / ticker
Using progressive disclosure was not only key in building the app, but also each component to avoid an initial feeling of visual / data overload for the user.
- User enters ticker.
- Composition defaults to todays date.
Inputs
Run Calculation
Enter a ticker
Composition date: 2025-01-01
Shares
Notional
Add a Primary Offering +
Add a Secondary Offering +
Additional Inputs
Pricing date
Offer Price
Discount
Trade date
Third part allotment:
Filing date
Trade date
Table Component Wireframes
- Variations of the table were required to display Current Compositions, Calculations and History. The wireframes below also use progressive disclosure by housing additional row data within expandable rows.
Calculation Table
Direct Index Implications
Total:
Shares: - |
USD: - |
ADV: -
Series
FTSE GEIS
MSCI
Segment
-
-
Timing
-
-
Announced Date
-
-
Trade Date
-
-
Effective Date
-
-
Conviction
-
-
Shares
-
-
USD
-
-
ADV
-
-
MSCI Current → proforma composition changes
proforma
current
change
Segment
-
-
-
Shares
-
-
-
Free float
-
-
-
FNOS
-
-
-
Intra Quarter Reasoning
Requirement
-
-
-
Actual value
-
-
-
Met
-
-
-
USTSM
S&P
-
-
-
-
-
-
-
-
-
-
-
-
-
-
-
-
-
-
Calculator History Table
- Filters were also needed in this table to allow users to search for their desired row faster. These filters are for Ticker, Category (Calculation or Simulation) and Ownership (Owner or Shared).
Ticker
AAPL UW
1812 JT
ID
-
-
Name
-
-
Date Created
-
-
Category
-
-
Subcategory
-
-
Ownership
-
-
Shares
Share
Share
USD
Download
Download
Inputs
name
-
-
-
Value
-
-
-
Direct Index Implications
Total:
Shares: - |
USD: - |
ADV: -
Series
FTSE GEIS
MSCI
Segment
-
-
Timing
-
-
Announce Date
-
-
Trade Date
-
-
Effective Date
-
-
Conviction
-
-
Shares
-
-
USD
-
-
ADV
-
-
USTSM
S&P
-
-
-
-
-
-
-
-
-
-
-
-
-
-
-
-
-
-
Share Calculation Modal Wireframes
Share Calculation
Enter Email
Upload CSV
Enter user email addresses
abcdefghijk@hedgefund.com
abcdefghijk@hedgefund.com
abcdefghijk@hedgefund.com
abcdefghijk@hedgefund.com
abcdefghijk@hedgefund.com
abcdefghijk@hedgefund.com
abcdefghijk@hedgefund.com
abcdefghijk@hedgefund.com
Cancel
Send
- Modal had to allow for quick and easy sharing of calculations.
- Ability to show recently uploaded CSVs means users don’t need to constantly upload files they use frequently multiple times.
- A users ‘Group’ would be shown in the dropdown when typing.
Implementation & Launch
- Built the production front end in Retool, implementing components with HTML, CSS, and JavaScript while utilising AI-assisted code to accelerate development. Delivered production-ready UI and handled QA for front-end flows.
- Translated Figma components into Retool with performance-minded workarounds for platform constraints.
- Collaborated closely with backend engineers to wire API endpoints.
- Delivered production-ready UI and handled QA for front-end flows.
- Beta product was launched to users.
Running a Calculation
Key Learnings
- Bridging design and engineering was essential. Working directly in Retool tightened design-to-delivery cycles.
- AI as a design engineer’s assistant helped speed development but still needed human review for accuracy.
- Consistent component systems made new tools feel instantly familiar to users.
- Iterative validation with analysts ensured outputs matched domain expectations before public release.
- If I were to do it again, I’d push stakeholders to get ECM user feedback earlier so there is a product fit on launch.