Passive Fund Intelligence
Product Type:
Web App
Roles:
Junior Product Designer
Tools Used:
Figma
Time period:
07/2023 - 08/2024
Overview
I worked on the redesign of Passive Fund Intelligence, the company flagship product used by professionals involved in Index Rebalance trading.
The legacy product suffered from outdated UX and UI, inconsistent user flows, and technical limitations that made it difficult to scale or introduce new features. As a Junior Product Designer, I collaborated with a Senior Product Designer, two front-end engineers, and a backend engineer to modernise the interface, rebuild the information architecture, and create a more intuitive experience. The redesign introduced new dashboards, modular components, and a cohesive design system, improving user workflows and driving adoption across clients.

Role
Junior Product Designer

Team
1x Senior Product Designer
2x Front-End Engineers
1x Backend Engineer

Users
166 users December 2024 just before the redesign was launched → 339 users as of November 2025

Project Impact
Improved adoption and sales, modernised UI, and faster user workflows

Outcome & Impact
Monthly Repeated Usage Score: August 2024 → November 2025
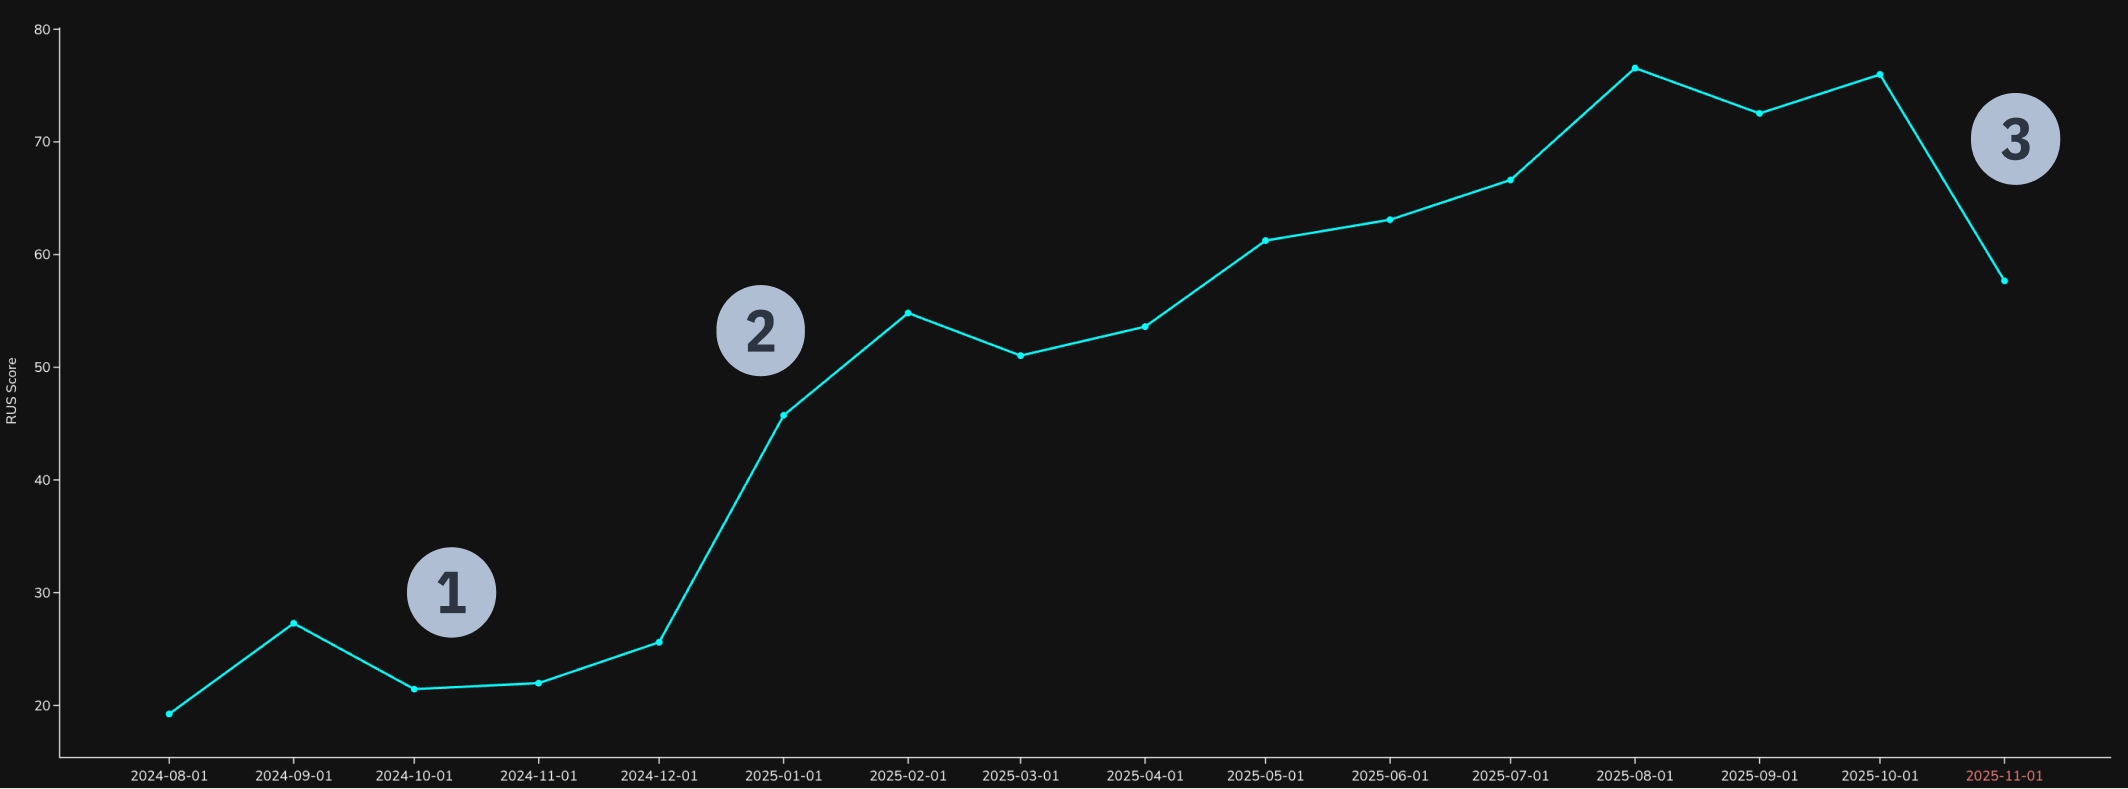
1
Legacy product usage before the migration to the updated product.
2
Migration begins along with a new sales push. Product usage more than doubles.
3
Usage still being calculated for this month and on track to surpassing the previous month.

Project Start

Challenge
The legacy version of Passive Fund Intelligence had become difficult to maintain and extend. Inconsistent design patterns, outdated technology, and unclear user flows created friction for both users and the development team. Adding new functionality was time-consuming due to UI limitations and technical debt. Our challenge was to rebuild the platform from the ground up, improving usability, scalability, and feature flexibility while ensuring continuity for existing users.

Goals
- Modernise the interface with a consistent design system.
- Improve performance and scalability for future product expansion.
- Streamline workflows for users performing complex index rebalance tasks.
- Increase usability, adoption, and overall product satisfaction.
- Enable engineers to deliver new features faster through modular components.

Constraints
- Large redesign scope with many areas to modernise simultaneously.
- Balancing user feedback, stakeholder priorities, and technical feasibility.
- High workload across the team.
- Introducing a new design system while maintaining visual consistency during transition.

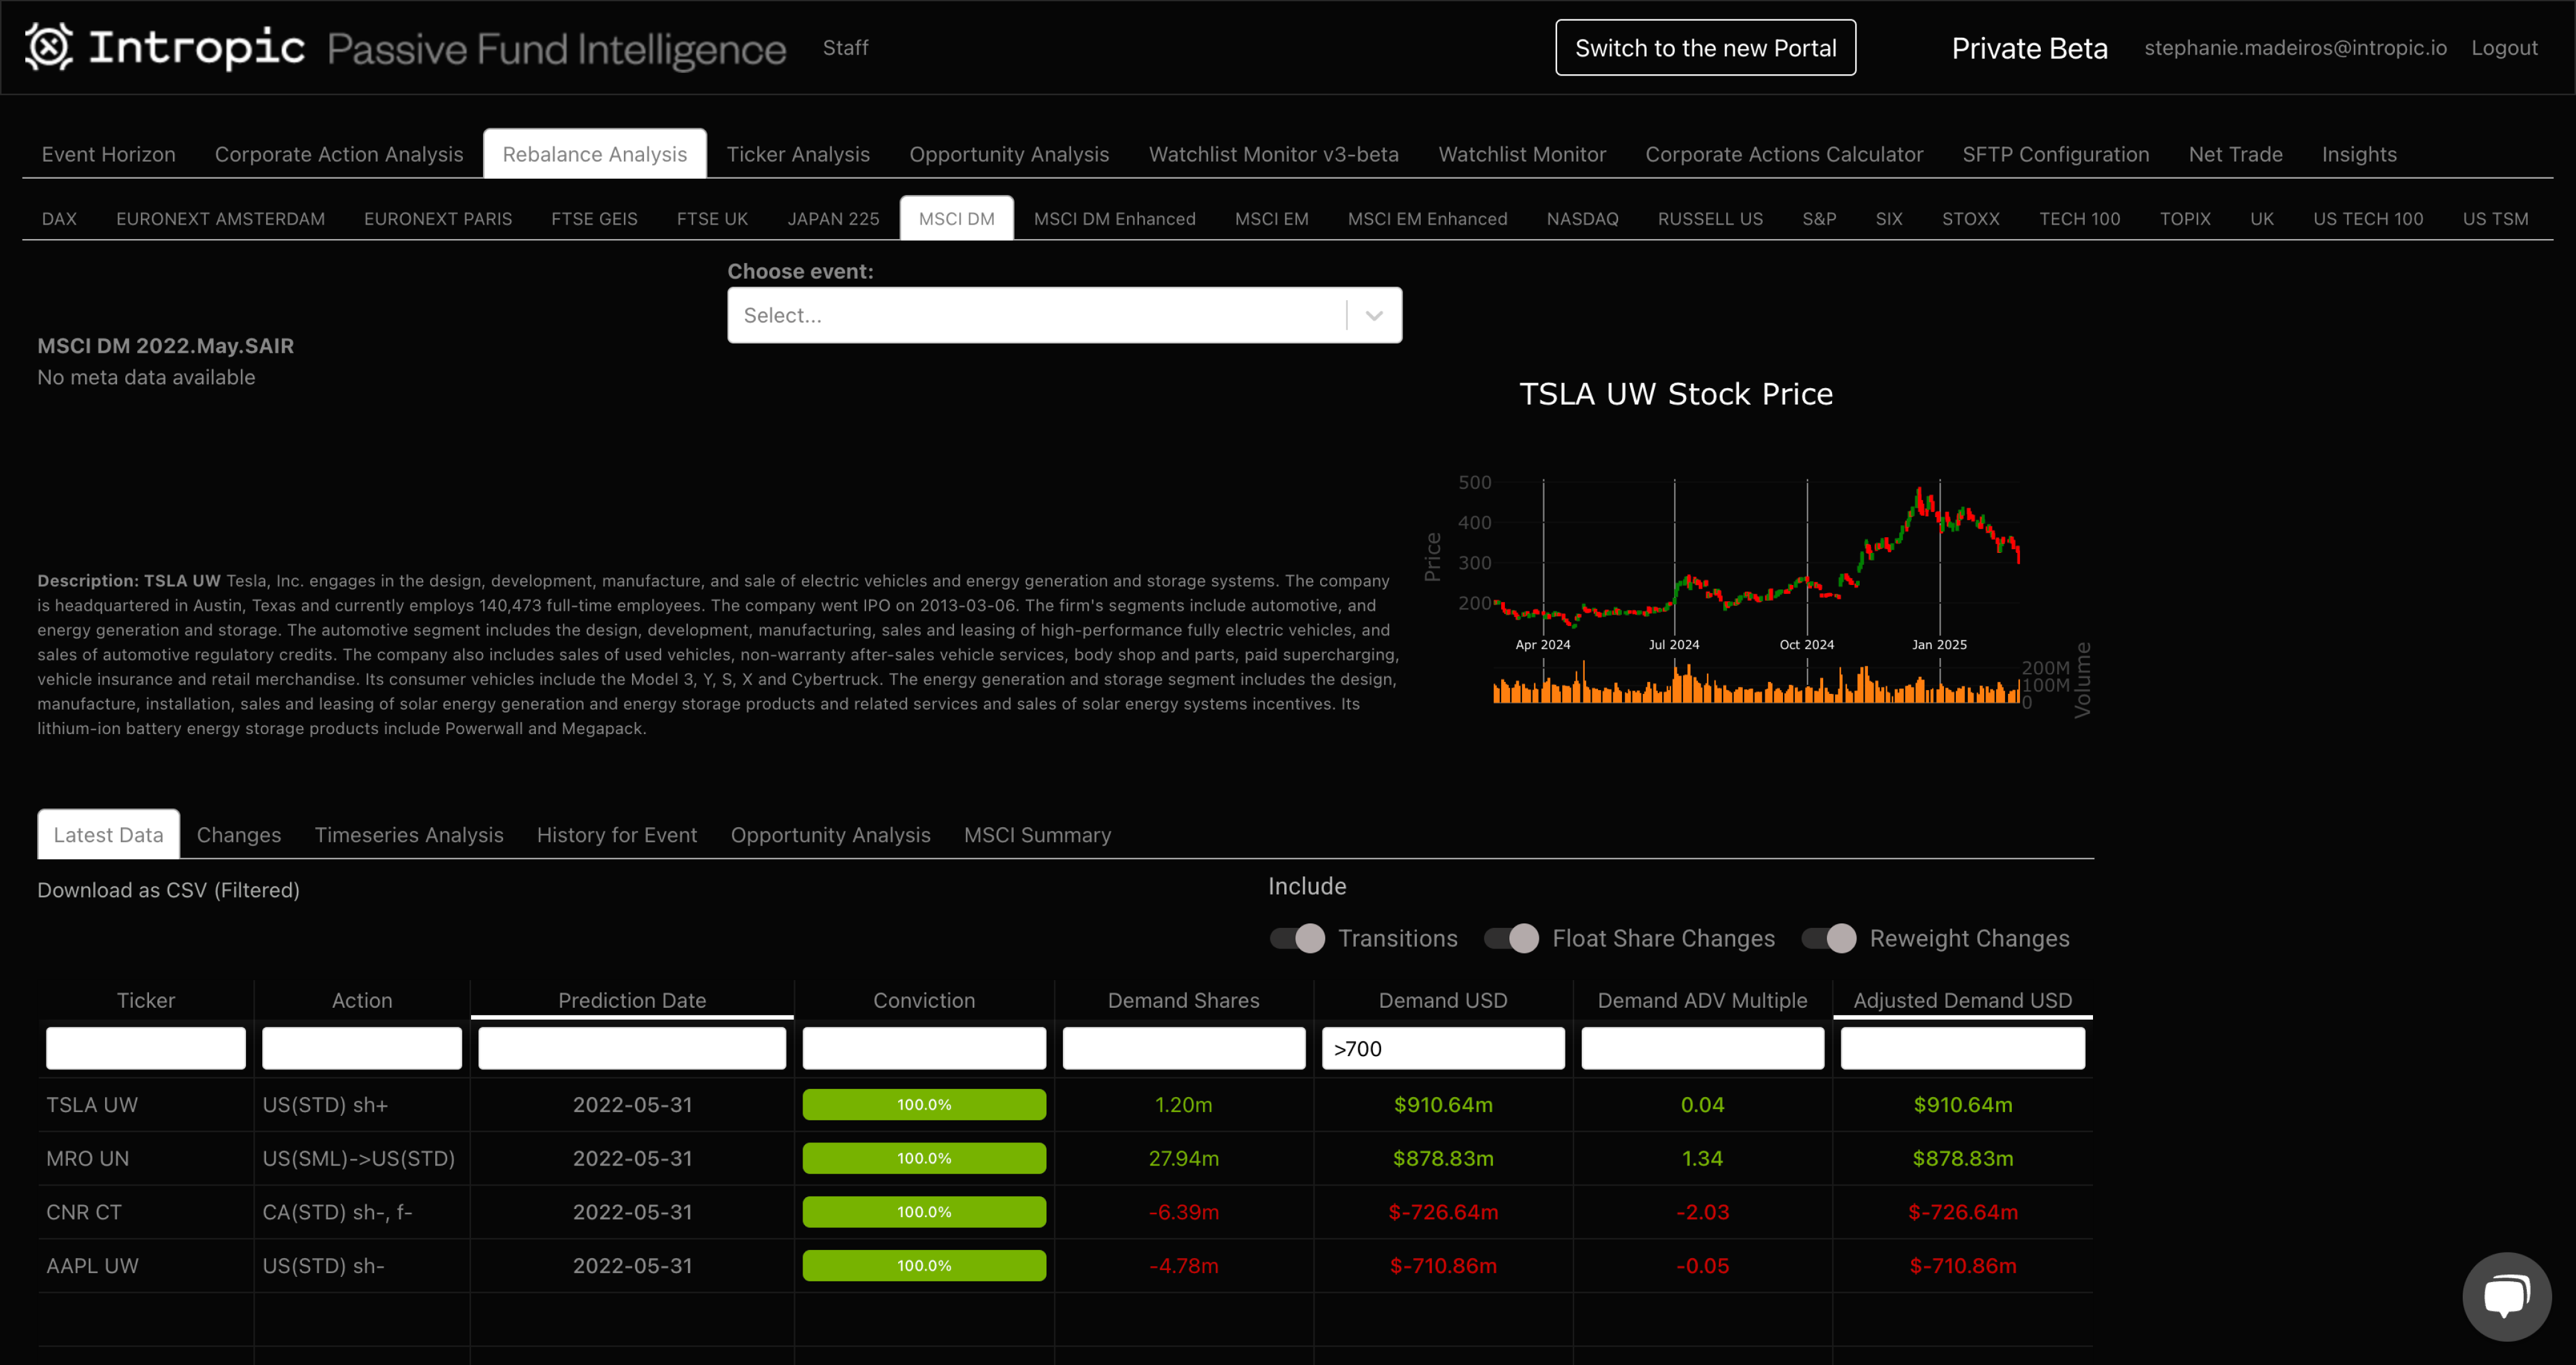
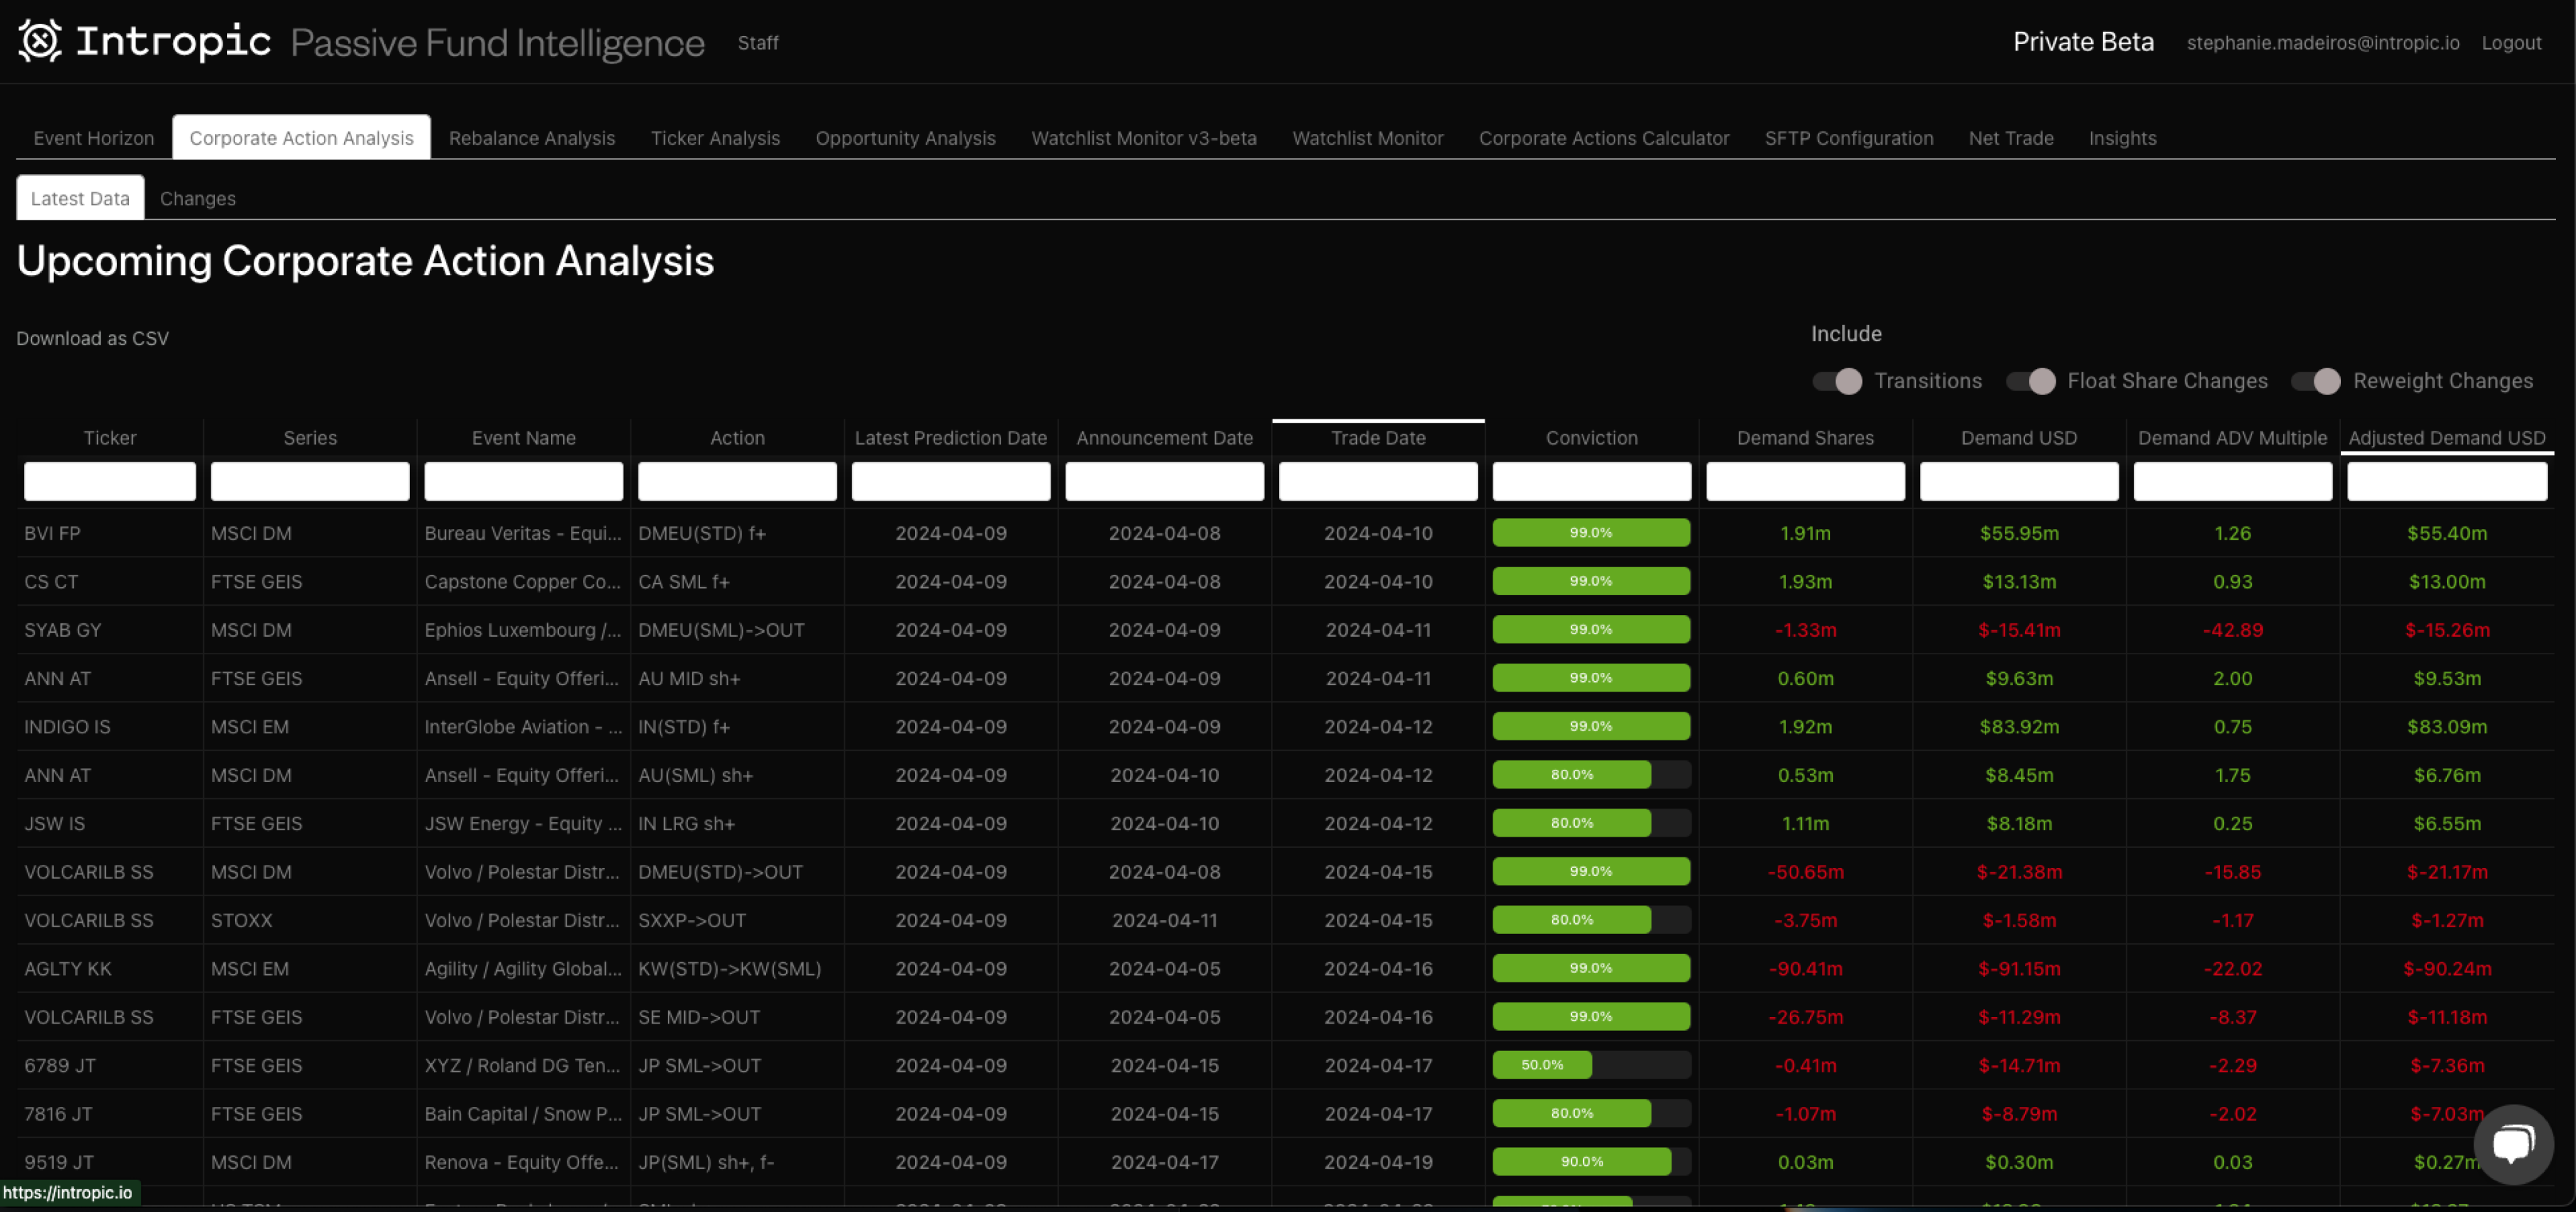
Legacy Product
Main Issues
Navigation and Information Hierarchy
The product relied on horizontal rows of tabs to switch between modules and filters which blurred the line between navigation and data filtering.
User Experience Flow
The “Latest Data”, “Changes”, and “Timeseries” views were treated as filters rather than distinct analytical perspectives, which confused users about whether they were changing content or state.
Cognitive Load and Learnability
Analysts relied on internal guides to remember where to find certain metrics, indicating low discoverability.
Technical & Interaction Limitations
Static layout templates limited responsiveness and scalability.
- Navigation mixed with filters, causing confusion between modules and datasets.
- Filters presented as tabs made workflows unintuitive and non-linear.

Research & Discovery
- Collaboration with analysts, client team and their analytics tools, and internal stakeholders helped me understand user goals and pain points.
Rebalance Analysts / Traders

User feedback sessions
- Reported difficulty following old navigation and inconsistent component behaviour.

Prototype testing
- Desired displays for deeper analysis and more control of filtering data.
Internal Engineers & Client Team

Design audits
- Engineers needed modular, reusable components compatible with React to reduce future build time.

Regular sprint handoffs
- Client team emphasised simplifying demos and onboarding flows.
Stakeholders
Interview sessions
- Needed scalable layouts for new feature additions.

Design review sessions
- Requested improved visual hierarchy for complex data tables.

Information Architecture and Feature Requests
- The Research & Discovery phase helped us put together an IA and list of new features for the product:
User Flow / Information Architecture Overview


Rebalance Analysis


All Forecasts
Changed Forecasts
New Forecasts
Expired Forecasts
Corporate Actions
All Forecasts
Changed Forecasts
New Forecasts
Expired Forecasts
Ticker Analysis

Latest Upcoming
All Latest
Timeseries
All Forecasts
Insights
Required Feature / Component
User need it solves
All Forecasts Page
- Allow users full a starting point for full customisation of results.
Improved / Added Filters
- Users needed more custom filters incl. around region, event type, and time of forecast.
Conviction History
- A way to show how the conviction for a forecast changed over time.
Aggregated USD and ADV
- Show the total USD and ADV that is potentially available given a users current filters.
Ticker Analysis Page
- A place to search by Ticker and have all data for that ticker displayed and filterable.
Insights Page
- Somewhere for company produced Insight articles to be accessible.

Design & Iteration
- Working closely with the Senior Designer, I contributed to the design of key interface components, dashboard layouts, and interaction patterns.
- We collaborated in Figma using the new design system to ensure alignment across modules, while continuously testing prototypes with stakeholders and analysts.
Iteration highlights
- Conducted weekly review sessions with engineering to validate component feasibility.
- Rebuilt the data tables for scalability and dark-mode compatibility.
- Simplified filter behaviour across modules for consistent UX.
- Designed responsive layouts optimised for large datasets.
Design System & UI Improvements
Area
Update
Outcome
Typography & Spacing
- Defined consistent typographic styles and hierarchy.
- Improved readability across dense data screens.
Colour & States
- Introduced accessible contrast levels and interactive states.
- Enabled faster design iteration and developer implementation.
Components
- Built modular components (tables, filters, tabs, panels).
- Enabled faster design iteration and developer implementation.
UI Patterns
- Standardised modals, dropdowns, and tab navigation.
- Reduced cognitive load and improved user familiarity.
Examples of components designed for the updated app
Atoms / Components for Drop Down Menus
Clicked

Unselected
Hover
Drop down searchbar
Text
Drop down heading
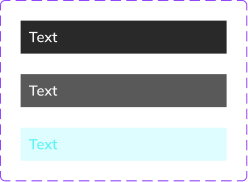
Drop down option
Unselected
Hover
Clicked
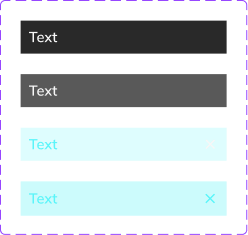
Drop down multiple selection option
Unselected
Hover
Clicked
Hover over selected option
Drop down divider
Drop down container (please set to hug)
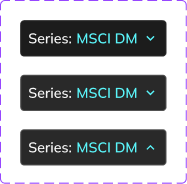
Series Filter
Series:
MSCI DM

Default
Series:
MSCI DM
Hover
Default
Hover
Clicked
Series:
MSCI DM

Selected

Search...
Global
FTSE GEIS
MSCI EM
MSCI EM Enhanced
MSCI DM
MSCI DM Enhanced
GLOBAL RED
AMER
RUSSELL US
S&P
US TSM
US3000
US1500
EMEA
EURONEXT PARIS
EURONEXT AMSTERDAM
DAX
SIX
STOXX
FTSE UK
UK
APAC
TOPIX
Series:
MSCI DM
Drop down hover
Search...
Global
MSCI EM
MSCI EM Enhanced
MSCI DM
MSCI DM Enhanced
GLOBAL RED
AMER
RUSSELL US
S&P
US TSM
US3000
US1500
EMEA
EURONEXT PARIS
EURONEXT AMSTERDAM
DAX
SIX
STOXX
FTSE UK
UK
APAC
TOPIX
Series:
MSCI DM
Drop down selection
Search...
Global
FTSE GEIS
MSCI EM
MSCI EM Enhanced
MSCI DM
MSCI DM Enhanced
GLOBAL RED
AMER
RUSSELL US
S&P
US TSM
US3000
US1500
EMEA
EURONEXT PARIS
EURONEXT AMSTERDAM
DAX
SIX
STOXX
FTSE UK
UK
APAC
TOPIX
Series:
MSCI DM
Search hover
Search...
Global
FTSE GEIS
MSCI EM
MSCI EM Enhanced
MSCI DM
MSCI DM Enhanced
GLOBAL RED
AMER
RUSSELL US
S&P
US TSM
US3000
US1500
EMEA
EURONEXT PARIS
EURONEXT AMSTERDAM
DAX
SIX
STOXX
FTSE UK
UK
APAC
TOPIX

Series:
MSCI DM
Search selected

I
Global
FTSE GEIS
MSCI EM
MSCI EM Enhanced
MSCI DM
MSCI DM Enhanced
GLOBAL RED
AMER
RUSSELL US
S&P
US TSM
US3000
US1500
EMEA
EURONEXT PARIS
EURONEXT AMSTERDAM
DAX
SIX
STOXX
FTSE UK
UK
APAC
TOPIX

Search...
Global
FTSE GEIS
MSCI EM
MSCI EM Enhanced
MSCI DM
MSCI DM Enhanced
GLOBAL RED
AMER
RUSSELL US
S&P
US TSM
US3000
US1500
EMEA
EURONEXT PARIS
EURONEXT AMSTERDAM
DAX
SIX
STOXX
FTSE UK
UK
APAC
TOPIX
Divider

Divider
Divider
Divider
Divider
Divider
Divider
Divider
Divider
Divider
Series Drop Down Menu Rebalance Analysis + Set Default Series

Search...
Global
FTSE GEIS
MSCI EM
MSCI EM Enhanced
MSCI DM
MSCI DM Enhanced
GLOBAL RED
AMER
RUSSELL US
S&P
US TSM
US3000
US1500
EMEA
EURONEXT PARIS
EURONEXT AMSTERDAM
DAX
Default
SIX
STOXX
FTSE UK
UK
APAC
TOPIX
Default
Search...
Global
FTSE GEIS
MSCI EM Enhanced
MSCI DM
MSCI DM Enhanced
GLOBAL RED
AMER
RUSSELL US
S&P
US TSM
US3000
US1500
EMEA
EURONEXT PARIS
EURONEXT AMSTERDAM
DAX
Default
SIX
STOXX
FTSE UK
UK
APAC
TOPIX
Hover


Search...
Global
FTSE GEIS
MSCI EM
Set default
MSCI EM Enhanced
MSCI DM
MSCI DM Enhanced
GLOBAL RED
AMER
RUSSELL US
S&P
US TSM
US3000
US1500
EMEA
EURONEXT PARIS
EURONEXT AMSTERDAM
DAX
Default
SIX
STOXX
FTSE UK
UK
APAC
TOPIX
Selected
Search...
Global
FTSE GEIS
MSCI EM
Set default
MSCI EM Enhanced
MSCI DM
MSCI DM Enhanced
GLOBAL RED
AMER
RUSSELL US
S&P
US TSM
US3000
US1500
EMEA
EURONEXT PARIS
EURONEXT AMSTERDAM
DAX
Default
SIX
STOXX
FTSE UK
UK
APAC
TOPIX
Search hover

I
Global
FTSE GEIS
MSCI EM
Set default
MSCI EM Enhanced
MSCI DM
MSCI DM Enhanced
GLOBAL RED
AMER
RUSSELL US
S&P
US TSM
US3000
US1500
EMEA
EURONEXT PARIS
EURONEXT AMSTERDAM
DAX
Default
SIX
STOXX
FTSE UK
UK
APAC
TOPIX
Search selected
Top Navigation Bar

All Forecasts
Rebalance Analysis
Corporation Actions
Ticker Analysis
Insights

S
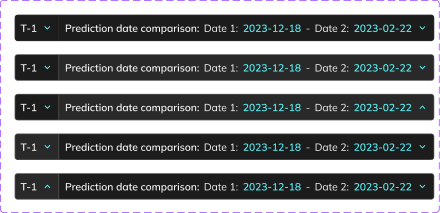
Prediction Date Selector
T-1

Prediction date comparison:
Date 1:
2023-12-18
-
Date 2:
2023-02-22

Default
T-1
Hover
Unselected
Hover over dates
Dates clicked
T drop down clicked
T drop down hover
T-1

Prediction date comparison:
Date 1:
2023-12-18
-
Date 2:
2023-02-22

Clicked
Date 1
2024-04-16
Date 2
2024-04-17
April 2024

S
M
T
W
T
F
S
1
1
2
3
4
5
6
7
8
9
10
11
12
13
14
15
16
17
18
19
20
21
22
23
24
25
26
27
28
29
30
1
1
1
1
Done
Prediction date comparison:
Date 1:
2023-12-18
-
Date 2:
2023-02-22

When T- Drop down is hovered
T-1

Prediction date comparison:
Date 1:
2023-12-18
-
Date 2:
2023-02-22
When T- Drop down is clicked
T-1
T-2
T-3
T-4
T-5
Custom
Tab Component
Default
All forecasts
Changed forecasts
New forecasts
Expired forecasts


Unselected
Hover
Selected
Hovering over tab
All forecasts
Changed forecasts
New forecasts
Expired forecasts
Selected other tab
All forecasts
Changed forecasts
New forecasts
Expired forecasts
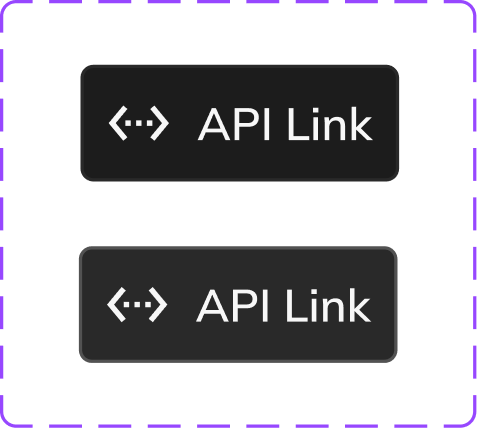
Single Buttons - Download, Fullscreen, API Link
Default
Download
Hover
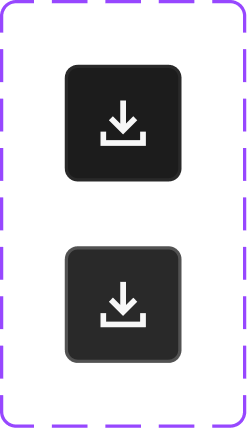
Default
Fullscreen
Hover

Default
API Link
Hover
Demand and Conviction Filter
Default
Demand & Conviction

Hover
Demand & Conviction
Default
Hover
Clicked
Filter on
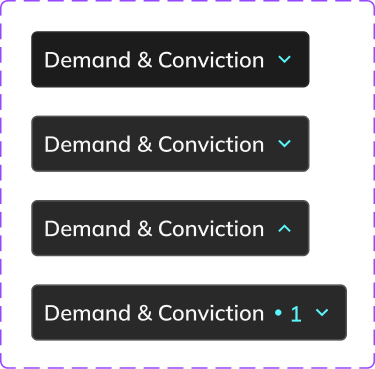
Selected
Demand & Conviction

Demand & Conviction Filters
Conviction

Minimum
Maximum
0.1%
99%
Aggregate Adjusted Demand
USD
Absolute value

Minimum
Maximum
$-0.08m
$3438.71m
ADV
Absolute value
Minimum
Maximum
-14.22
27.90
Expected Adjusted Passive Demand
USD
Absolute value

Minimum
Maximum
$-0.08m
$3438.71m
ADV
Absolute value
Minimum
Maximum
-14.22
27.90
Clear all
Show 54 Results

Filter applied
Demand & Conviction

1
Ticker Analysis Searchbar
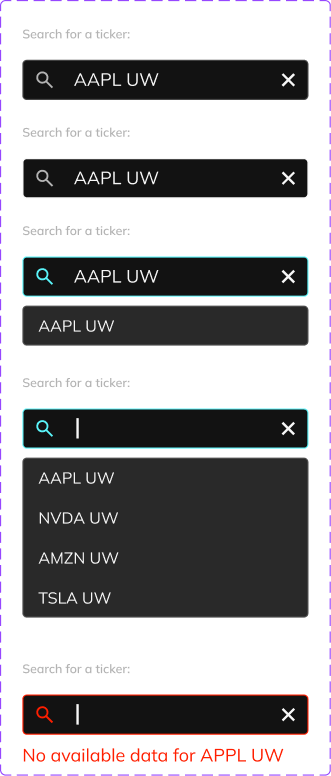
Default - (Reset t when clicking outside search box)
Hover
Clicked
Clicking ‘X’
Error message when ticker not found
Searchbar Drop Down
AAPL UW
NVDA UW
AMZN UW
TSLA UW
Default
TSLA UW
TSLA UW
TSLA UW
TSLA UW

Hover over option
AAPL UW
NVDA UW
AMZN UW
TSLA UW
Clicked on option
Default
Hover
Clicked

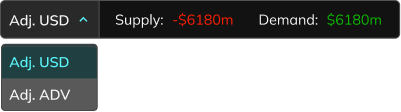
Aggregate Value Component
Adj. USD

Supply:
-$6180m
Demand:
$6180m
Default
Supply:
-$6180m
Demand:
$6180m
Hover
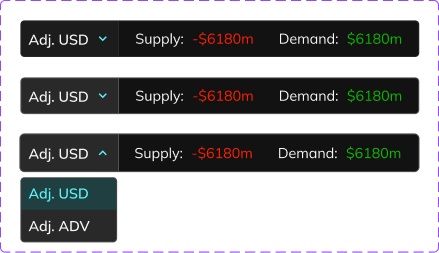
Default
Hover
Clicked
Clicked
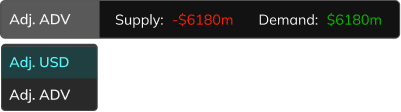
Drop down hover


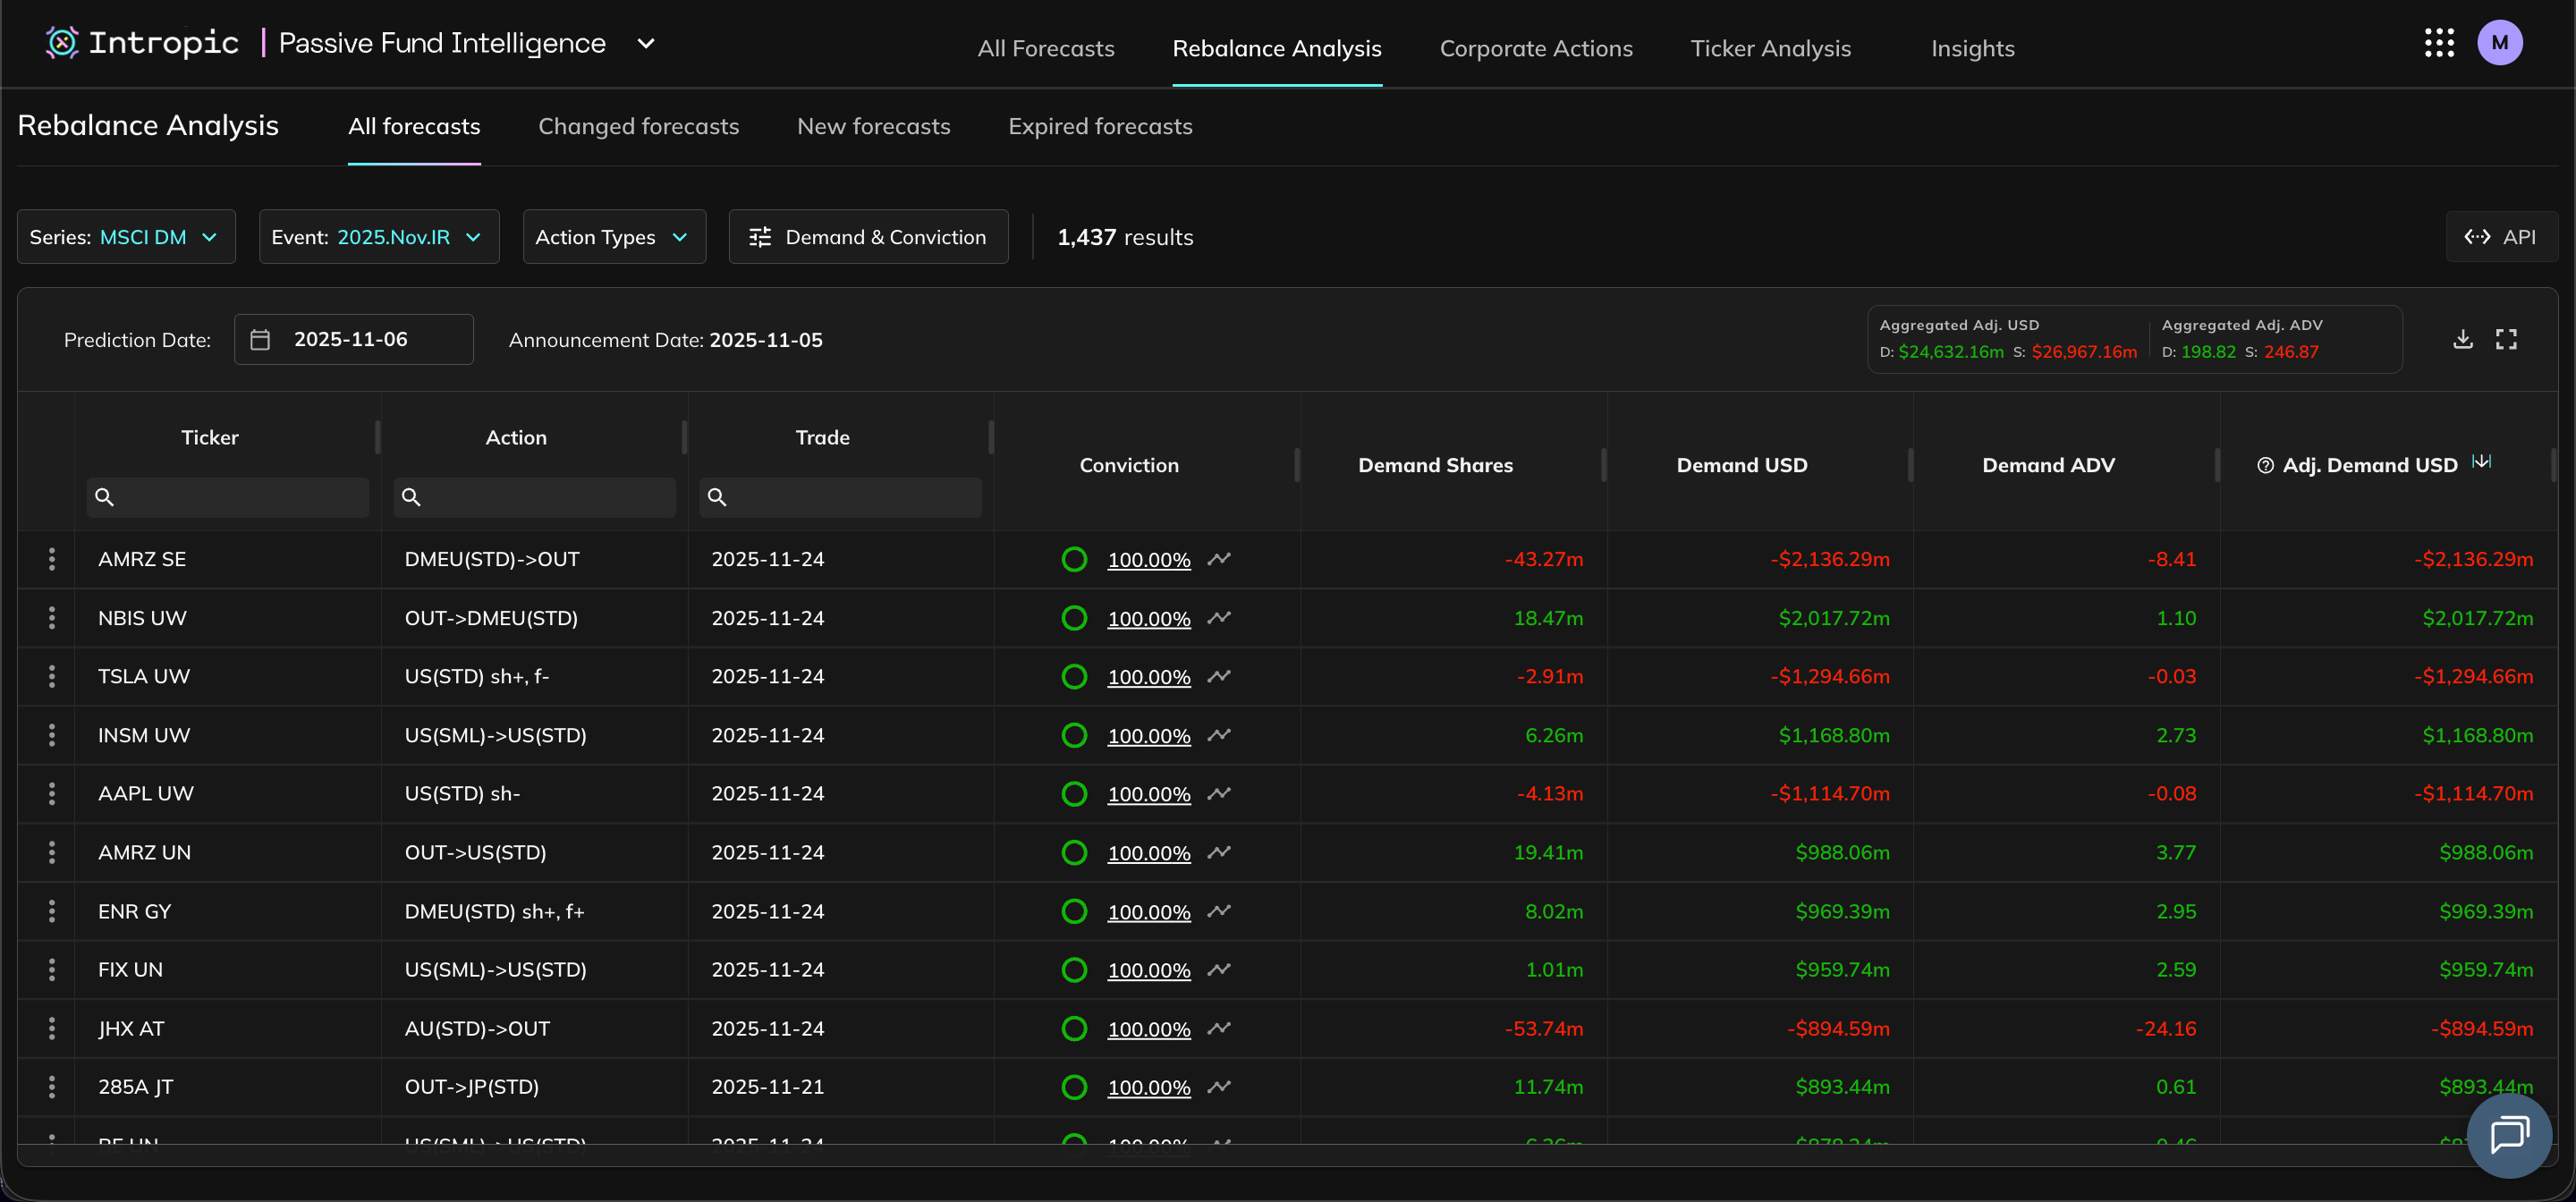
Examples of redesigned responsive page screens
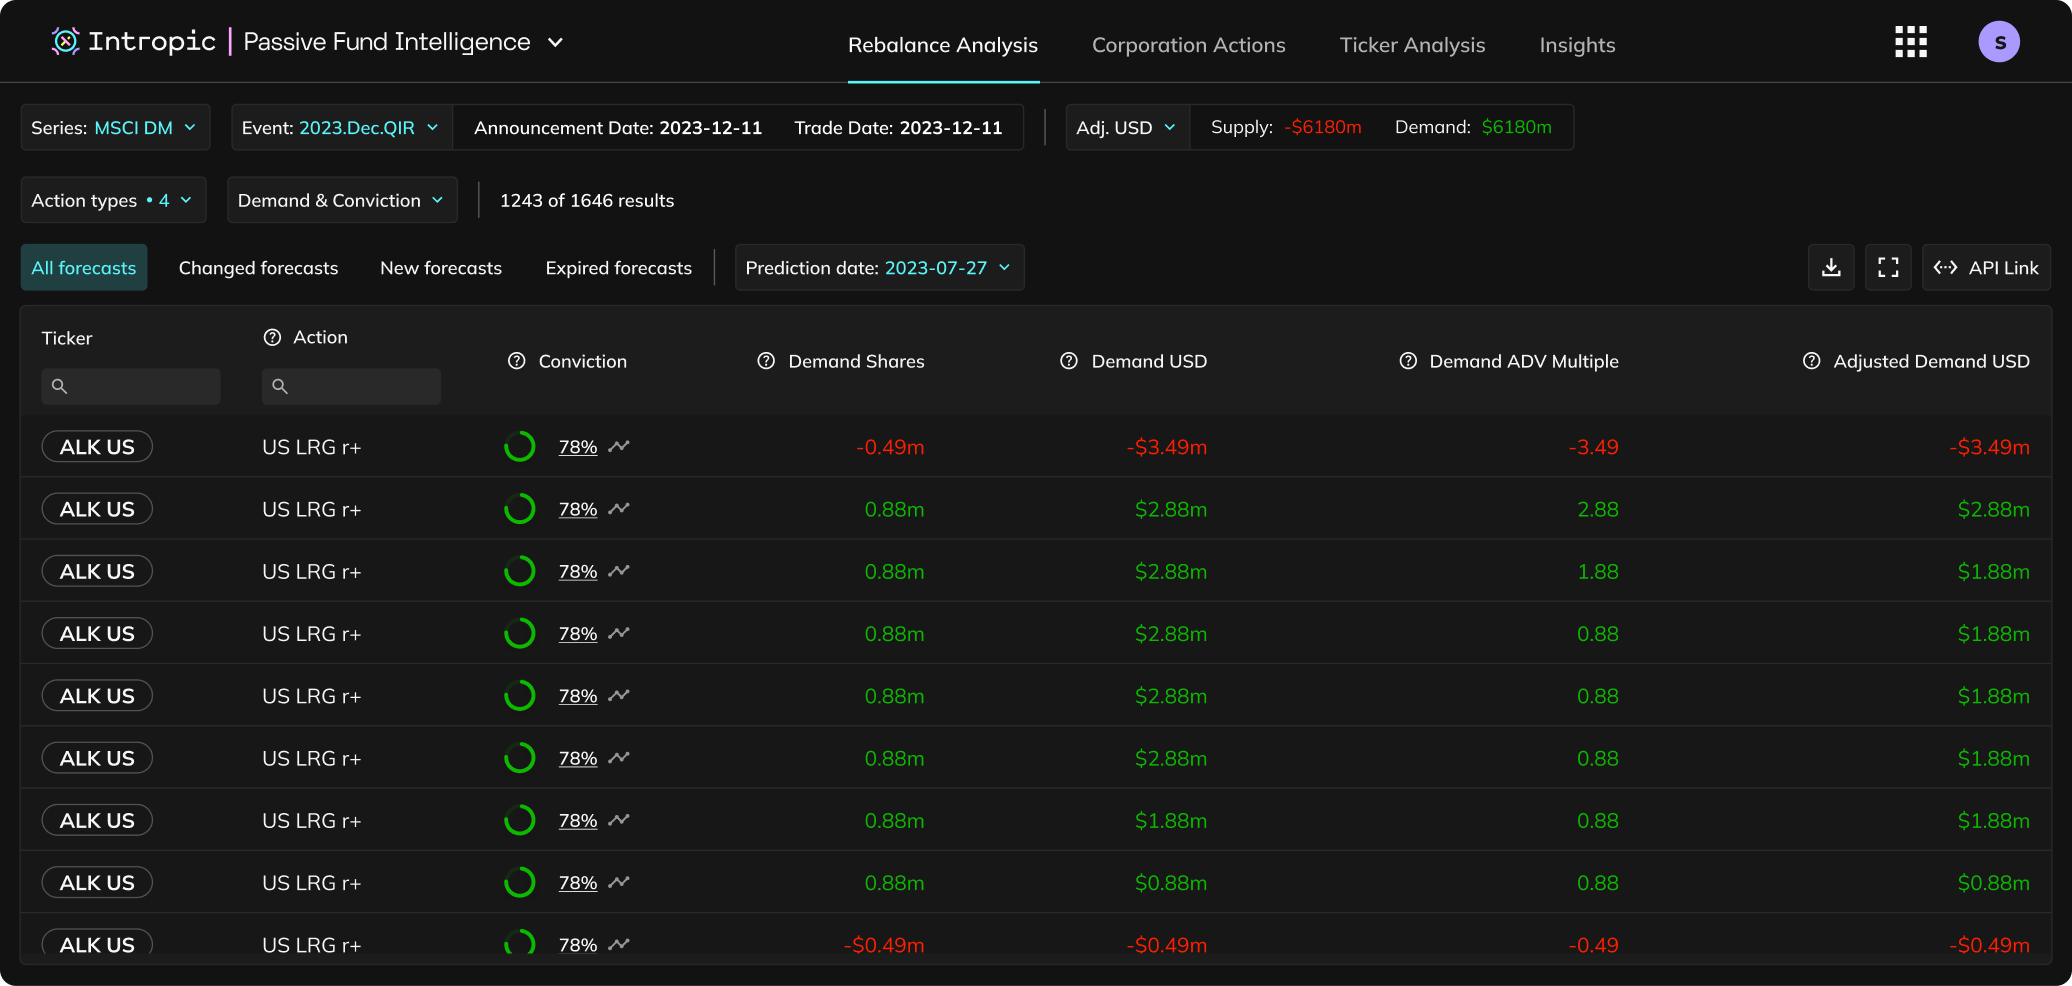
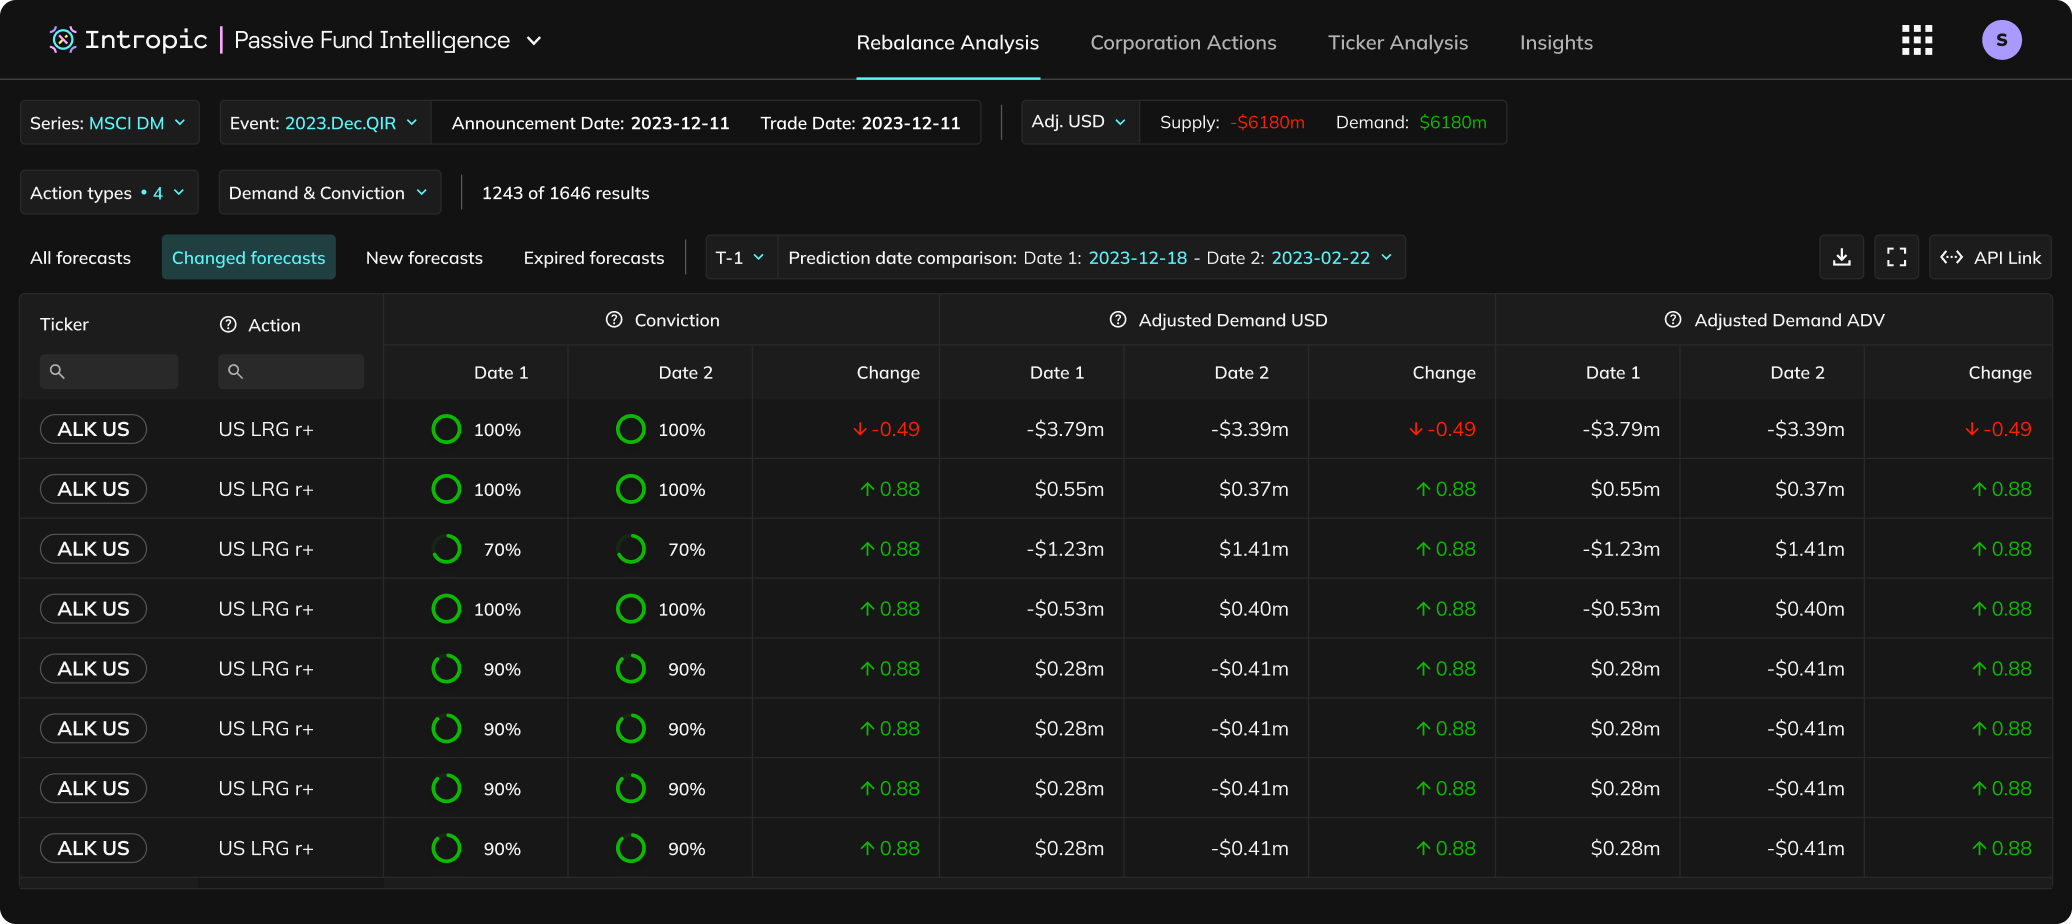
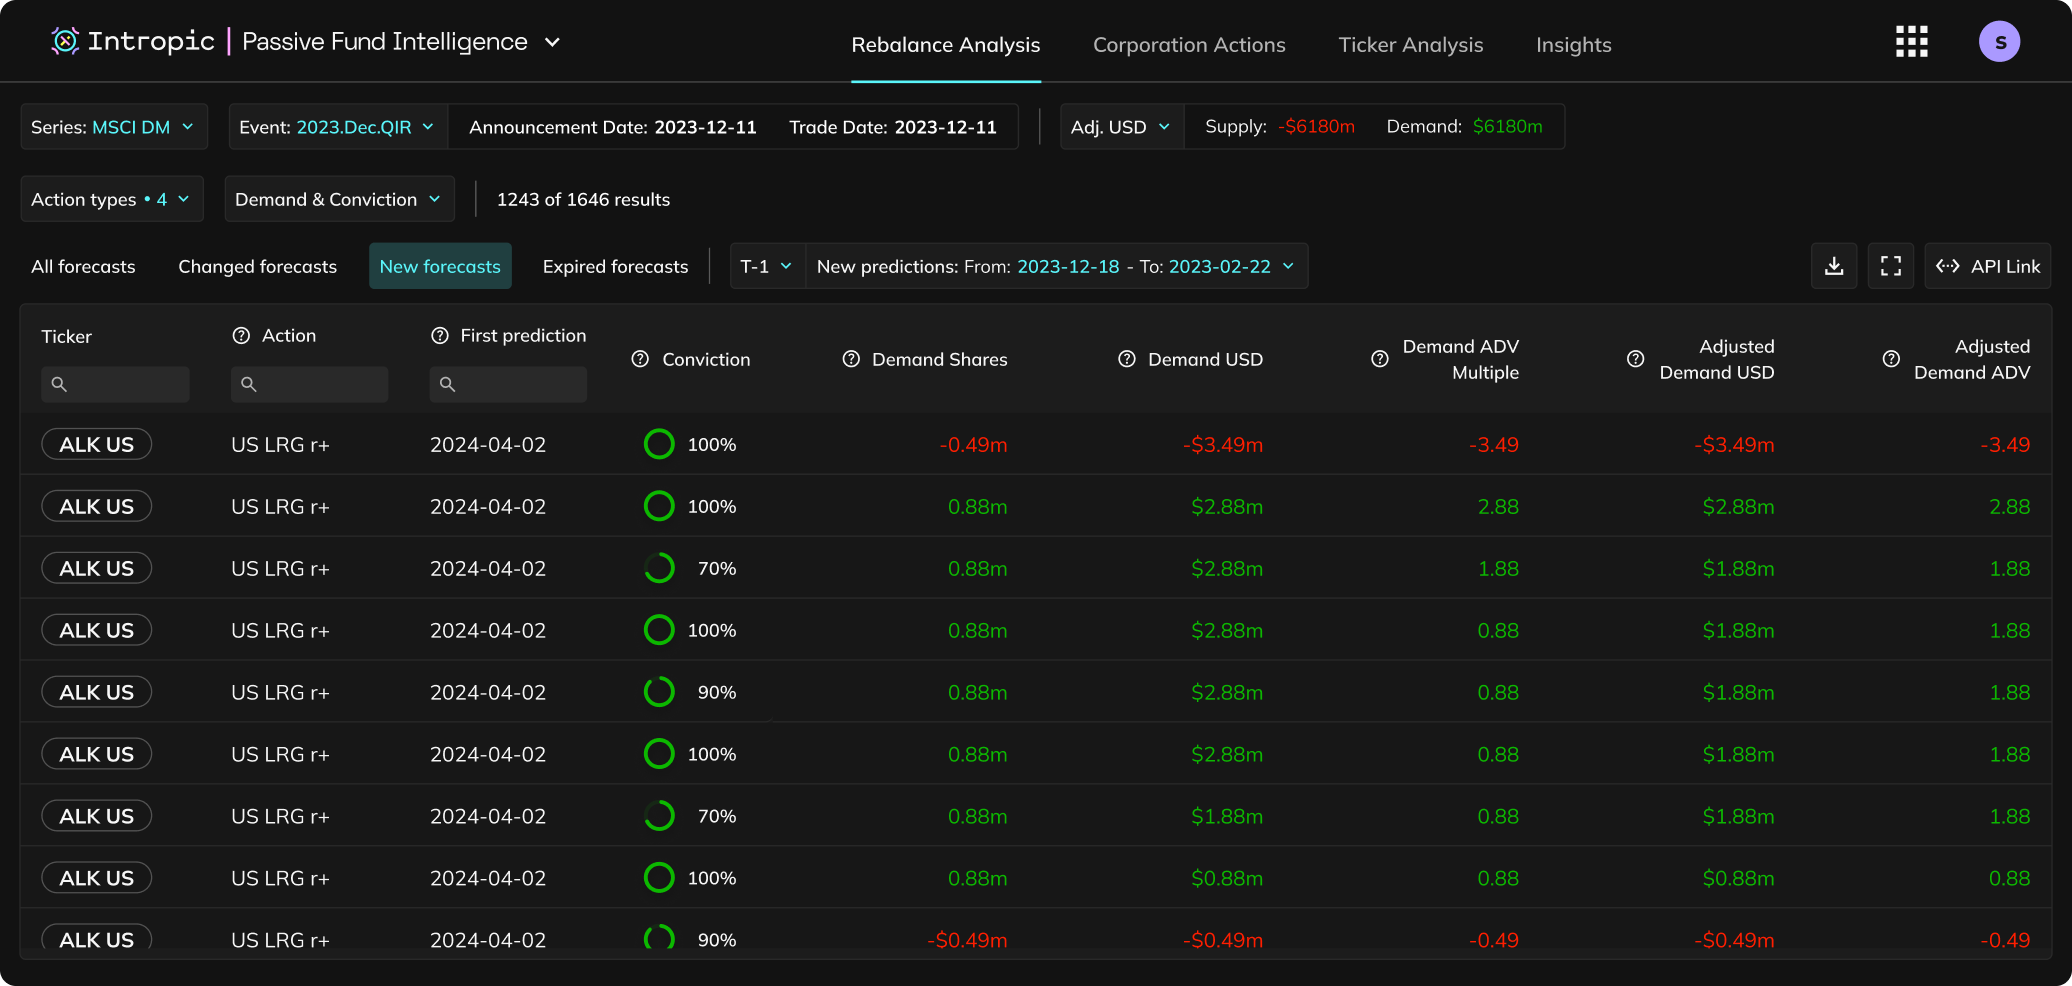
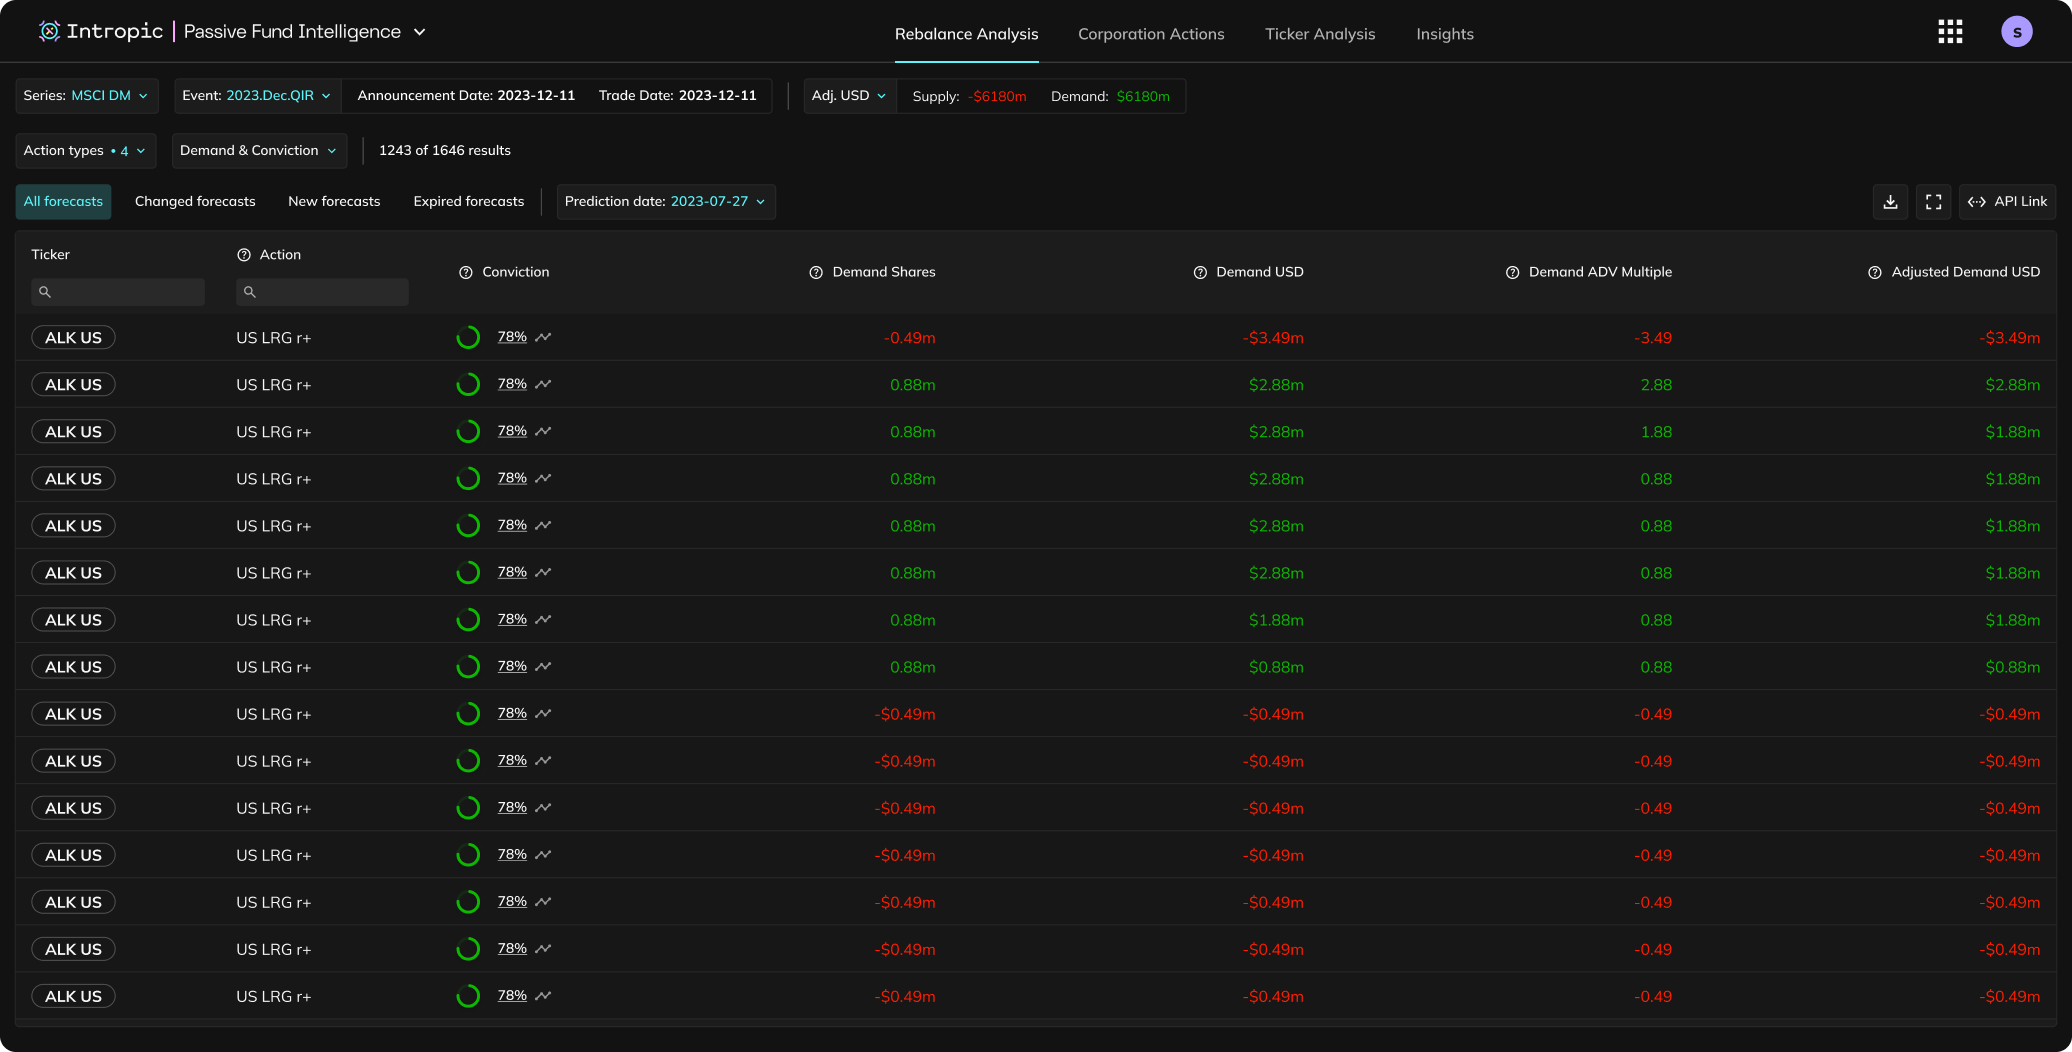

1440px - Rebalance Analysis All Forecasts
Example of new feature (Conviction Timeseries Modal)
- Users needed to see how forecast convictions change over time to help better understand what drives them and create a sense of trust and transparency.
- Integrating it into the main table made the feature easily findable and did not impede user work flows.
- The new design system helped easily create components and a modal in Figma that the engineering team could quickly bring into production.
Conviction button
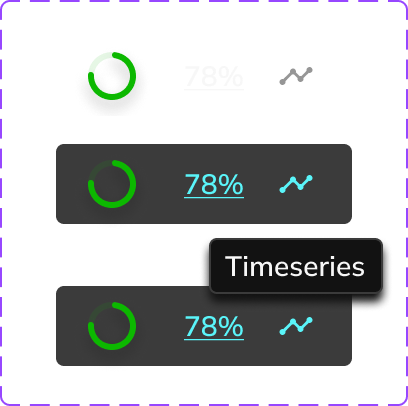
Default
Hover
Hover over over graph icon
Conviction button within row
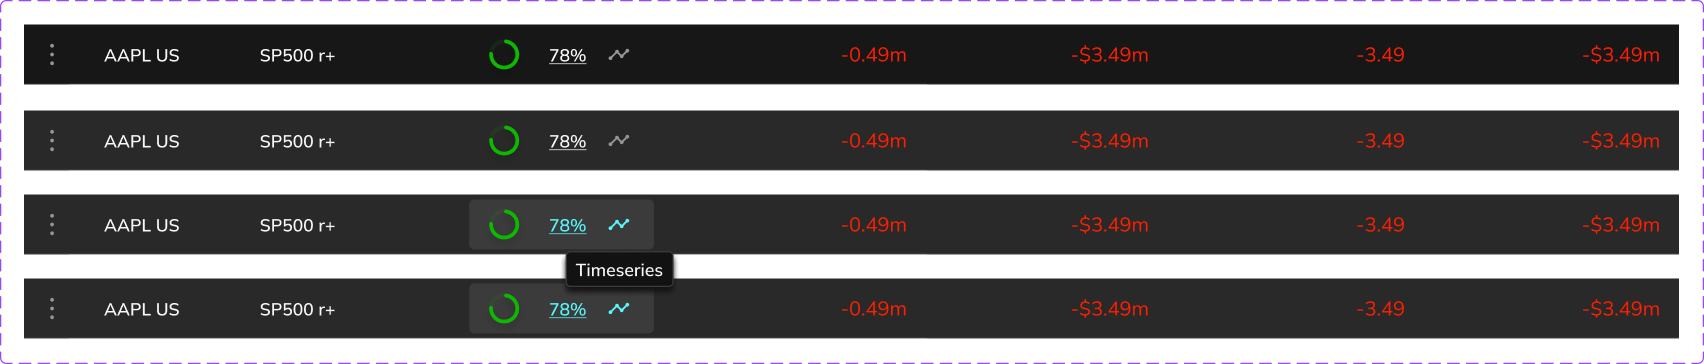
Default
Hover
Over over button
Over over graph icon
Modal when opened after clicking the Conviction Button
Timeseries view for:
AAPL US

S&P
2024.Jun.QIR
SP500 r+
Announcement date: 2023-12-11
Trade date: 2024-06-08

Prediction date (dd/mm)
Prediction date (dd/mm)

20-07
25-07
30-07
04-08
09-08
14-08
19-08
24-08
03-09
08-09
13-09
18-09
23-09
28-09
03-10
08-10
13-10
18-10
23-10
28-10
02-11
07-11
12-11
17-11
22-11

Latest


Prediction date:
2023-11-10
ADV Multiple:
-3.49m
Adjusted Demand:
-$8888.49m
Conviction:
79%


82%
Conviction (%)

100
90
70
60
50
40
30
20
10
0

Announcement
2023-12-11
First prediction
Modal in Action

Implementation & Launch
- As part of the cross-functional team, I worked closely with engineers during sprint planning and design handoff.
- I contributed to writing tickets, maintaining design documentation, and ensuring smooth collaboration between design and development.
- This process included regular QA sessions, accessibility checks, and async design updates through shared Figma libraries.

Key Learnings
- Learned how to work effectively with senior designers and engineers through agile sprints and clear documentation.
- Improved at writing tickets, preparing specs, and translating design intent for development.
- Gained experience designing within a shared design system and contributing new components.
- Learned how to present design rationale, gather feedback, and balance business goals with user needs.
- Learned to focus on incremental improvements while maintaining long-term design direction.
Passive Fund Intelligence
Product Type:
Web App
Roles:
Junior Product Designer
Tools Used:
Figma
Time period:
07/2023 - 08/2024
Overview
I worked on the redesign of Passive Fund Intelligence, the company flagship product used by professionals involved in Index Rebalance trading.
The legacy product suffered from outdated UX and UI, inconsistent user flows, and technical limitations that made it difficult to scale or introduce new features. As a Junior Product Designer, I collaborated with a Senior Product Designer, two front-end engineers, and a backend engineer to modernise the interface, rebuild the information architecture, and create a more intuitive experience. The redesign introduced new dashboards, modular components, and a cohesive design system, improving user workflows and driving adoption across clients.
Role
Junior Product Designer
Team
1x Senior Product Designer
2x Front-End Engineers
1x Backend Engineer
Users
166 users December 2024 just before the redesign was launched → 339 users as of November 2025
Project Impact
Improved adoption and sales, modernised UI, and faster user workflows
Outcome & Impact
Monthly Repeated Usage Score: August 2024 → November 2025
1
Legacy product usage before the migration to the updated product.
2
Migration begins along with a new sales push. Product usage more than doubles.
3
Usage still being calculated for this month and on track to surpassing the previous month.
Project Start
Challenge
The legacy version of Passive Fund Intelligence had become difficult to maintain and extend. Inconsistent design patterns, outdated technology, and unclear user flows created friction for both users and the development team. Adding new functionality was time-consuming due to UI limitations and technical debt. Our challenge was to rebuild the platform from the ground up, improving usability, scalability, and feature flexibility while ensuring continuity for existing users.
Goals
- Modernise the interface with a consistent design system.
- Improve performance and scalability for future product expansion.
- Streamline workflows for users performing complex index rebalance tasks.
- Increase usability, adoption, and overall product satisfaction.
- Enable engineers to deliver new features faster through modular components.
Constraints
- Large redesign scope with many areas to modernise simultaneously.
- Balancing user feedback, stakeholder priorities, and technical feasibility.
- High workload across the team.
- Introducing a new design system while maintaining visual consistency during transition.
Legacy Product
Main Issues
Navigation and Information Hierarchy
The product relied on horizontal rows of tabs to switch between modules and filters which blurred the line between navigation and data filtering.
User Experience Flow
The “Latest Data”, “Changes”, and “Timeseries” views were treated as filters rather than distinct analytical perspectives, which confused users about whether they were changing content or state.
Cognitive Load and Learnability
Analysts relied on internal guides to remember where to find certain metrics, indicating low discoverability.
Technical & Interaction Limitations
Static layout templates limited responsiveness and scalability.
- Navigation mixed with filters, causing confusion between modules and datasets.
- Filters presented as tabs made workflows unintuitive and non-linear.
Research & Discovery
- Collaboration with analysts, client team and their analytics tools, and internal stakeholders helped me understand user goals and pain points.
Rebalance Analysts / Traders
User feedback sessions
- Reported difficulty following old navigation and inconsistent component behaviour.
Prototype testing
- Desired displays for deeper analysis and more control of filtering data.
Internal Engineers & Client Team
Design audits
- Engineers needed modular, reusable components compatible with React to reduce future build time.
Regular sprint handoffs
- Client team emphasised simplifying demos and onboarding flows.
Stakeholders
Interview sessions
- Needed scalable layouts for new feature additions.
Design review sessions
- Requested improved visual hierarchy for complex data tables.
Information Architecture and Feature Requests
- The Research & Discovery phase helped us put together an IA and list of new features for the product:
User Flow / Information Architecture Overview
Rebalance Analysis
All Forecasts
Changed Forecasts
New Forecasts
Expired Forecasts
Corporate Actions
All Forecasts
Changed Forecasts
New Forecasts
Expired Forecasts
Ticker Analysis
Latest Upcoming
All Latest
Timeseries
All Forecasts
Insights
Required Feature / Component
User need it solves
All Forecasts Page
- Allow users full a starting point for full customisation of results.
Improved / Added Filters
- Users needed more custom filters incl. around region, event type, and time of forecast.
Conviction History
- A way to show how the conviction for a forecast changed over time.
Aggregated USD and ADV
- Show the total USD and ADV that is potentially available given a users current filters.
Ticker Analysis Page
- A place to search by Ticker and have all data for that ticker displayed and filterable.
Insights Page
- Somewhere for company produced Insight articles to be accessible.
Design & Iteration
- Working closely with the Senior Designer, I contributed to the design of key interface components, dashboard layouts, and interaction patterns.
- We collaborated in Figma using the new design system to ensure alignment across modules, while continuously testing prototypes with stakeholders and analysts.
Iteration highlights
- Conducted weekly review sessions with engineering to validate component feasibility.
- Rebuilt the data tables for scalability and dark-mode compatibility.
- Simplified filter behaviour across modules for consistent UX.
- Designed responsive layouts optimised for large datasets.
Design System & UI Improvements
Area
Update
Outcome
Typography & Spacing
- Defined consistent typographic styles and hierarchy.
- Improved readability across dense data screens.
Colour & States
- Introduced accessible contrast levels and interactive states.
- Enabled faster design iteration and developer implementation.
Components
- Built modular components (tables, filters, tabs, panels).
- Enabled faster design iteration and developer implementation.
UI Patterns
- Standardised modals, dropdowns, and tab navigation.
- Reduced cognitive load and improved user familiarity.
Examples of components designed for the updated app
Atoms / Components for Drop Down Menus
Clicked
Unselected
Hover
Drop down searchbar
Text
Drop down heading
Drop down option
Unselected
Hover
Clicked
Drop down multiple selection option
Unselected
Hover
Clicked
Hover over selected option
Drop down divider
Drop down container (please set to hug)
Series Filter
Series:
MSCI DM
Default
Series:
MSCI DM
Hover
Default
Hover
Clicked
Series:
MSCI DM
Selected
Search...
Global
FTSE GEIS
MSCI EM
MSCI EM Enhanced
MSCI DM
MSCI DM Enhanced
GLOBAL RED
AMER
RUSSELL US
S&P
US TSM
US3000
US1500
EMEA
EURONEXT PARIS
EURONEXT AMSTERDAM
DAX
SIX
STOXX
FTSE UK
UK
APAC
TOPIX
Series:
MSCI DM
Drop down hover
Search...
Global
MSCI EM
MSCI EM Enhanced
MSCI DM
MSCI DM Enhanced
GLOBAL RED
AMER
RUSSELL US
S&P
US TSM
US3000
US1500
EMEA
EURONEXT PARIS
EURONEXT AMSTERDAM
DAX
SIX
STOXX
FTSE UK
UK
APAC
TOPIX
Series:
MSCI DM
Drop down selection
Search...
Global
FTSE GEIS
MSCI EM
MSCI EM Enhanced
MSCI DM
MSCI DM Enhanced
GLOBAL RED
AMER
RUSSELL US
S&P
US TSM
US3000
US1500
EMEA
EURONEXT PARIS
EURONEXT AMSTERDAM
DAX
SIX
STOXX
FTSE UK
UK
APAC
TOPIX
Series:
MSCI DM
Search hover
Search...
Global
FTSE GEIS
MSCI EM
MSCI EM Enhanced
MSCI DM
MSCI DM Enhanced
GLOBAL RED
AMER
RUSSELL US
S&P
US TSM
US3000
US1500
EMEA
EURONEXT PARIS
EURONEXT AMSTERDAM
DAX
SIX
STOXX
FTSE UK
UK
APAC
TOPIX
Series:
MSCI DM
Search selected
I
Global
FTSE GEIS
MSCI EM
MSCI EM Enhanced
MSCI DM
MSCI DM Enhanced
GLOBAL RED
AMER
RUSSELL US
S&P
US TSM
US3000
US1500
EMEA
EURONEXT PARIS
EURONEXT AMSTERDAM
DAX
SIX
STOXX
FTSE UK
UK
APAC
TOPIX
Search...
Global
FTSE GEIS
MSCI EM
MSCI EM Enhanced
MSCI DM
MSCI DM Enhanced
GLOBAL RED
AMER
RUSSELL US
S&P
US TSM
US3000
US1500
EMEA
EURONEXT PARIS
EURONEXT AMSTERDAM
DAX
SIX
STOXX
FTSE UK
UK
APAC
TOPIX
Divider
Divider
Divider
Divider
Divider
Divider
Divider
Divider
Divider
Divider
Series Drop Down Menu Rebalance Analysis + Set Default Series
Search...
Global
FTSE GEIS
MSCI EM
MSCI EM Enhanced
MSCI DM
MSCI DM Enhanced
GLOBAL RED
AMER
RUSSELL US
S&P
US TSM
US3000
US1500
EMEA
EURONEXT PARIS
EURONEXT AMSTERDAM
DAX
Default
SIX
STOXX
FTSE UK
UK
APAC
TOPIX
Default
Search...
Global
FTSE GEIS
MSCI EM Enhanced
MSCI DM
MSCI DM Enhanced
GLOBAL RED
AMER
RUSSELL US
S&P
US TSM
US3000
US1500
EMEA
EURONEXT PARIS
EURONEXT AMSTERDAM
DAX
Default
SIX
STOXX
FTSE UK
UK
APAC
TOPIX
Hover
Search...
Global
FTSE GEIS
MSCI EM
Set default
MSCI EM Enhanced
MSCI DM
MSCI DM Enhanced
GLOBAL RED
AMER
RUSSELL US
S&P
US TSM
US3000
US1500
EMEA
EURONEXT PARIS
EURONEXT AMSTERDAM
DAX
Default
SIX
STOXX
FTSE UK
UK
APAC
TOPIX
Selected
Search...
Global
FTSE GEIS
MSCI EM
Set default
MSCI EM Enhanced
MSCI DM
MSCI DM Enhanced
GLOBAL RED
AMER
RUSSELL US
S&P
US TSM
US3000
US1500
EMEA
EURONEXT PARIS
EURONEXT AMSTERDAM
DAX
Default
SIX
STOXX
FTSE UK
UK
APAC
TOPIX
Search hover
I
Global
FTSE GEIS
MSCI EM
Set default
MSCI EM Enhanced
MSCI DM
MSCI DM Enhanced
GLOBAL RED
AMER
RUSSELL US
S&P
US TSM
US3000
US1500
EMEA
EURONEXT PARIS
EURONEXT AMSTERDAM
DAX
Default
SIX
STOXX
FTSE UK
UK
APAC
TOPIX
Search selected
Top Navigation Bar
All Forecasts
Rebalance Analysis
Corporation Actions
Ticker Analysis
Insights
S
Prediction Date Selector
T-1
Prediction date comparison:
Date 1:
2023-12-18
-
Date 2:
2023-02-22
Default
T-1
Hover
Unselected
Hover over dates
Dates clicked
T drop down clicked
T drop down hover
T-1
Prediction date comparison:
Date 1:
2023-12-18
-
Date 2:
2023-02-22
Clicked
Date 1
2024-04-16
Date 2
2024-04-17
April 2024

S
M
T
W
T
F
S
1
1
2
3
4
5
6
7
8
9
10
11
12
13
14
15
16
17
18
19
20
21
22
23
24
25
26
27
28
29
30
1
1
1
1
Done
Prediction date comparison:
Date 1:
2023-12-18
-
Date 2:
2023-02-22
When T- Drop down is hovered
T-1

Prediction date comparison:
Date 1:
2023-12-18
-
Date 2:
2023-02-22
When T- Drop down is clicked
T-1
T-2
T-3
T-4
T-5
Custom
Tab Component
Default
All forecasts
Changed forecasts
New forecasts
Expired forecasts
Unselected
Hover
Selected
Hovering over tab
All forecasts
Changed forecasts
New forecasts
Expired forecasts
Selected other tab
All forecasts
Changed forecasts
New forecasts
Expired forecasts
Single Buttons - Download, Fullscreen, API Link
Default
Download
Hover
Default
Fullscreen
Hover
Default
API Link
Hover
Demand and Conviction Filter
Default
Demand & Conviction
Hover
Demand & Conviction
Default
Hover
Clicked
Filter on
Selected
Demand & Conviction
Demand & Conviction Filters
Conviction
Minimum
Maximum
0.1%
99%
Aggregate Adjusted Demand
USD
Absolute value
Minimum
Maximum
$-0.08m
$3438.71m
ADV
Absolute value
Minimum
Maximum
-14.22
27.90
Expected Adjusted Passive Demand
USD
Absolute value
Minimum
Maximum
$-0.08m
$3438.71m
ADV
Absolute value
Minimum
Maximum
-14.22
27.90
Clear all
Show 54 Results
Filter applied
Demand & Conviction
1
Ticker Analysis Searchbar
Default - (Reset t when clicking outside search box)
Hover
Clicked
Clicking ‘X’
Error message when ticker not found
Searchbar Drop Down
AAPL UW
NVDA UW
AMZN UW
TSLA UW
Default
TSLA UW
TSLA UW
TSLA UW
TSLA UW
Hover over option
AAPL UW
NVDA UW
AMZN UW
TSLA UW
Clicked on option
Default
Hover
Clicked
Aggregate Value Component
Adj. USD
Supply:
-$6180m
Demand:
$6180m
Default
Supply:
-$6180m
Demand:
$6180m
Hover
Default
Hover
Clicked
Clicked
Drop down hover
Examples of redesigned responsive page screens
1440px - Rebalance Analysis All Forecasts
Example of new feature (Conviction Timeseries Modal)
- Users needed to see how forecast convictions change over time to help better understand what drives them and create a sense of trust and transparency.
- Integrating it into the main table made the feature easily findable and did not impede user work flows.
- The new design system helped easily create components and a modal in Figma that the engineering team could quickly bring into production.
Conviction button
Default
Hover
Hover over over graph icon
Conviction button within row
Default
Hover
Over over button
Over over graph icon
Modal when opened after clicking the Conviction Button
Timeseries view for:
AAPL US
S&P
2024.Jun.QIR
SP500 r+
Announcement date: 2023-12-11
Trade date: 2024-06-08
Prediction date (dd/mm)
Prediction date (dd/mm)
20-07
25-07
30-07
04-08
09-08
14-08
19-08
24-08
03-09
08-09
13-09
18-09
23-09
28-09
03-10
08-10
13-10
18-10
23-10
28-10
02-11
07-11
12-11
17-11
22-11
Latest
Prediction date:
2023-11-10
ADV Multiple:
-3.49m
Adjusted Demand:
-$8888.49m
Conviction:
79%
82%
Conviction (%)
100
90
70
60
50
40
30
20
10
0
Announcement
2023-12-11
First prediction
Modal in Action
Implementation & Launch
- As part of the cross-functional team, I worked closely with engineers during sprint planning and design handoff.
- I contributed to writing tickets, maintaining design documentation, and ensuring smooth collaboration between design and development.
- This process included regular QA sessions, accessibility checks, and async design updates through shared Figma libraries.
Key Learnings
- Learned how to work effectively with senior designers and engineers through agile sprints and clear documentation.
- Improved at writing tickets, preparing specs, and translating design intent for development.
- Gained experience designing within a shared design system and contributing new components.
- Learned how to present design rationale, gather feedback, and balance business goals with user needs.
- Learned to focus on incremental improvements while maintaining long-term design direction.